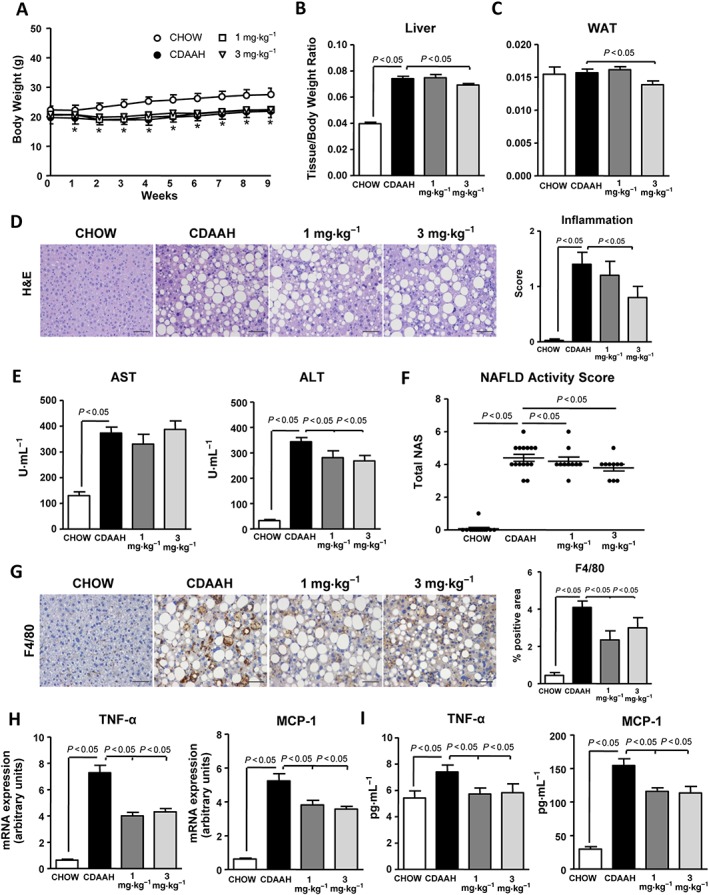
Figure 2.

Effects of IW‐1973 on hepatic inflammation. (A) Body weight changes during the 9 weeks of treatment in mice receiving chow diet (n = 10), CDAAH diet (n = 15), CDAAH plus sGC stimulator IW‐1973 at 1 mg·kg−1 (n = 10) or CDAAH plus IW‐1973 at 3 mg·kg−1 (n = 10). (B, C) Liver and WAT weights, expressed as tissue/body weight ratio. (D) Representative photomicrographs (200× magnification) of liver sections stained with H&E. (Right) Inflammation scores in H&E‐stained liver sections scored by a registered pathologist. (E) Plasma AST and ALT levels. (F) NAS. Inflammation and steatosis were scored by a registered pathologist. NAS was calculated as described in the Methods section. (G) Representative photomicrographs (200× magnification) of liver sections stained with a specific F4/80 antibody used for the assessment of macrophage infiltration. (Right) Histomorphometric analysis of the area stained with the macrophage specific F4/80 antibody. (H) Hepatic TNF‐α and MCP‐1 mRNA expression. (I) Hepatic TNF‐α and MCP‐1 levels. Results are expressed as mean ± SEM. *P < 0.05 for CDAAH versus CHOW. Scale bar = 50 μm.
