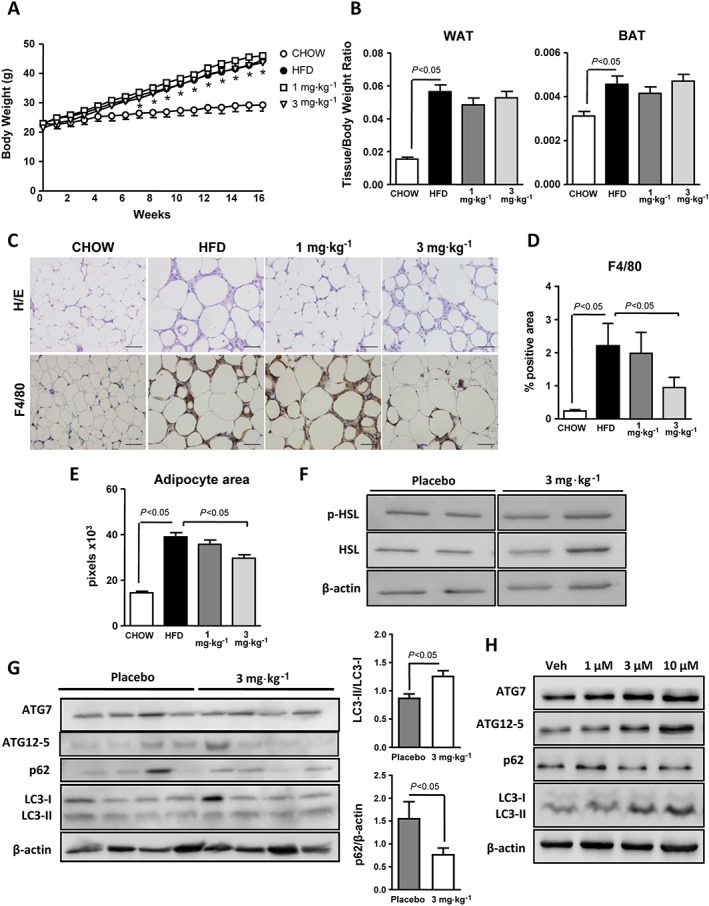
Figure 5.

Effects of IW‐1973 on WAT. (A) Body weight progression during the 16 weeks of treatment of the mice receiving chow diet (n = 5), HFD diet (n = 10), HFD plus sGC stimulator IW‐1973 at 1 mg·kg−1 (n = 10) or HFD plus IW‐1973 at 3 mg·kg−1 (n = 10). (B) WAT and BAT weight to body weight ratios. (C) Representative photomicrographs (200× magnification) of WAT sections stained with H&E and a specific F4/80 antibody. (D) Histomorphometric analysis of the area immunostained with the specific F4/80 macrophage antibody. (E) Adipocyte area assessed by ImageJ morphometric analysis as described in the Methods section. (F) p‐HSL and β‐actin determined in WAT by SDS‐PAGE Western blot. (G) ATG7, ATG12‐5, p62, LC3‐I/ II and β‐actin determined in WAT by SDS‐PAGE Western blot analysis. The densitometric analyses of LC3‐II/LC3‐I ratio and p62 are shown on the right. (H) ATG7, ATG12‐5, p62, LC3‐I/LC3‐II and β‐actin in differentiated 3T3 adipocytes incubated with vehicle (Veh) or increasing concentrations of IW‐1973 (1, 3 and 10 μM). Results are expressed as mean ± SEM. *P < 0.05 for HFD versus CHOW. Blot data subjected to statistical analysis were from n = 5 experiments. Scale bar = 50 μm.
