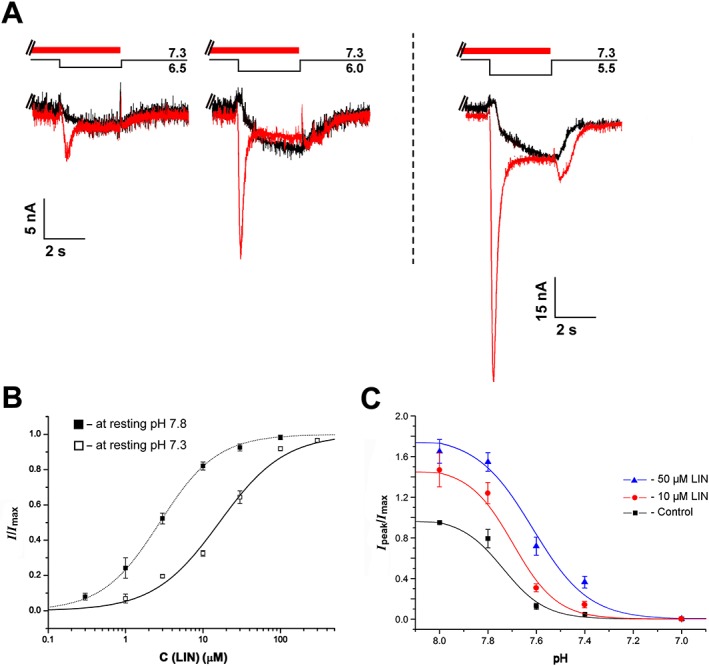
Figure 7.

LIN‐induced recovery of the transient hASIC3 current. (A) Whole‐cell currents recorded from human ASIC3 channels held at pH 7.3 in response to different pH stimuli in the presence (red) or absence (black) of 0.1 mM LIN pre‐incubated for 15 s before the pH stimulus. (B) Dose–response curves for potentiation of hASIC3 currents by LIN at the holding pH 7.3 and 7.8. For both pHs, the pH of the activating stimulus was 5.5. The maximum amplitude (I max) was calculated for each cell by individual fitting, and the data were normalized to it, then the normalized data were averaged and fitted by the logistic equation. Correspondingly, solid and dotted lines through the points fit with the logistic equation. Data are mean ± SEM (n = 6). (C) pH dependence of hASIC3 steady‐state desensitization (SSD) in the absence and presence of 10 and 50 μM LIN. hASIC3 held at various conditioning pHs was activated by pH 5.5 stimulus. The peak current amplitudes are plotted as a function of pH and fitted (solid lines) with the logistic equation [pHSSD50 = 7.73 ± 0.03 (n H = 6.90 ± 0.74) for control vs. pHSSD50 = 7.70 ± 0.03 (n H = 6.81 ± 2.82) for 10 μM LIN and pHSSD50 = 7.62 ± 0.04 (n H = 3.1 ± 1.4) for 50 μM LIN] showing no significant shift in the SSD curve in the presence of LIN. Data are mean ± SEM (n = 6).
