
Figure 8.
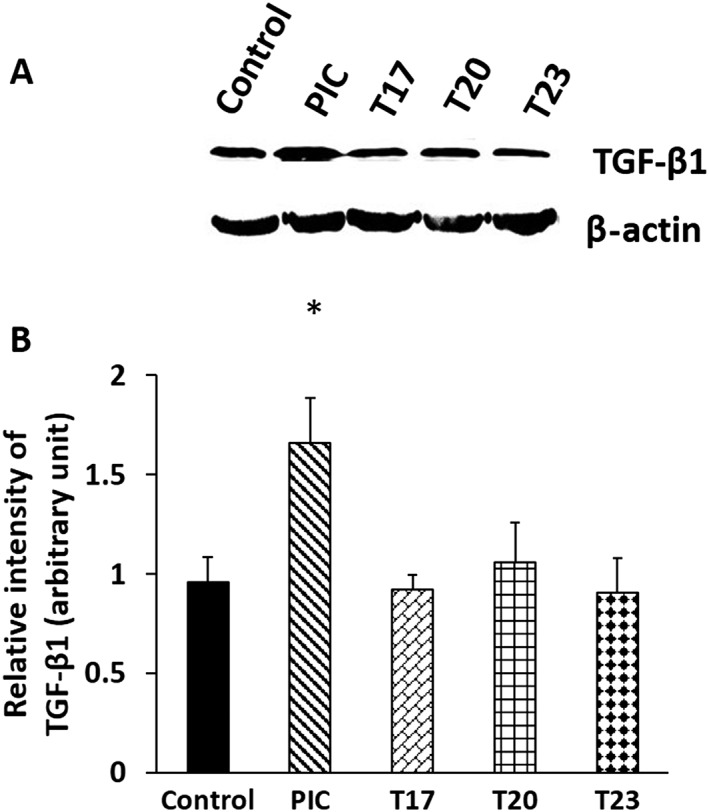
(A) Western blot and (B) quantification for TGF‐β1 protein from the fibroblast lysates of tanshinones T17, T20 and T23‐treated, E64‐containing PIC‐treated and untreated cells for 48 h. Data represent mean ± SD (n = 4 independent experiments). *P < 0.05 significantly different from untreated samples; ns, not significant.