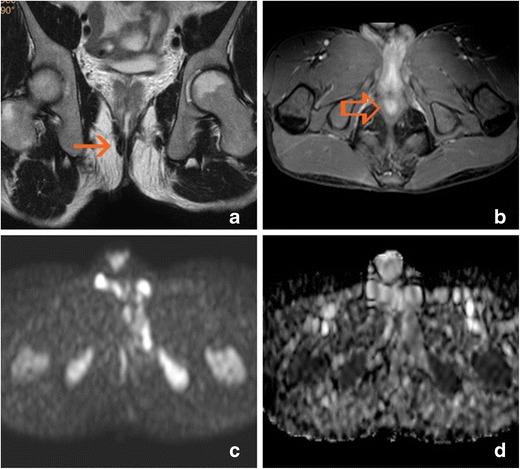
Fig. 6.

Anal fibrous stenosis. The internal anal sphincter shows hypointensity on T2-weighted sequences and diffuse enhancement after gadolinium administration (arrows); the native diffusion-weighted image and the ADC map show hypointensity. a Oblique-coronal T2-weighted image. b Post-gadolinium oblique-transverse fat-supressed gradient echo T1-weighted image. c Native oblique-transverse native diffusion-weighted image with 800 s/mm2 b factor. d ADC map
