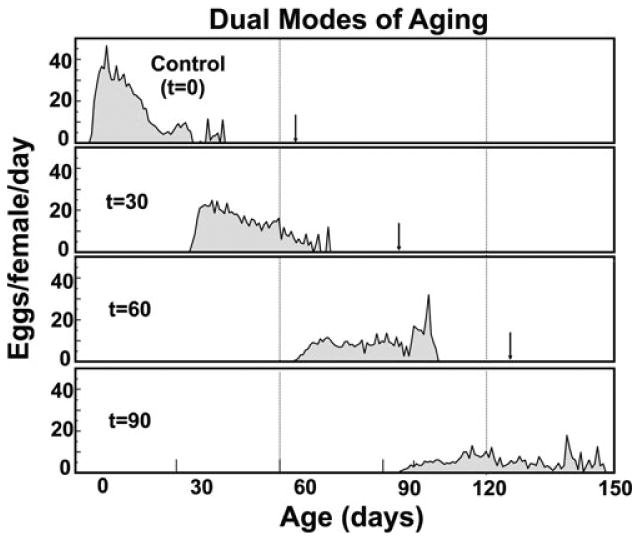
Figure 4.

Event history graphs for medflies given access to different calorie restriction treatments.19 The time t (day) at which flies given access to the full (sugar + protein) diet indicated at left within each panel. Arrows indicate age of death of oldest flies within each treatment.
