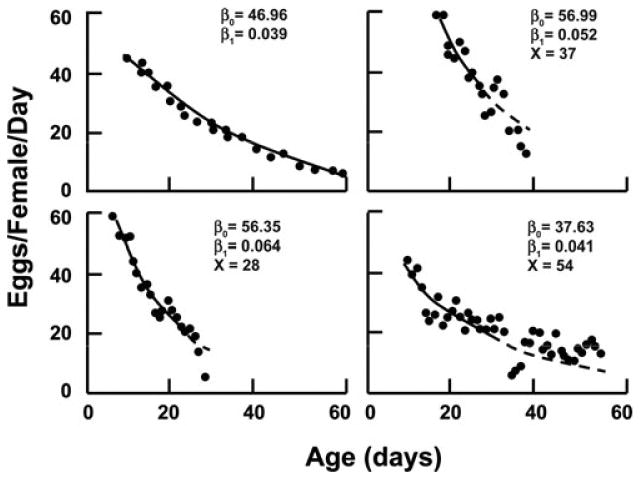
Figure 5.

Trajectory of fecundity and mortality in the medfly.22 The trajectories of fecundity for individual flies are fitted to data from the peak to day 25 (solid line) by nonlinear least squares and predicted thereafter (dashed line). Each panel depicts the reproduction of individual females in which reproductive peak, the rate of decrease (i.e., slope) and age of death are denoted by β0, β1, and X, respectively. Note that the greater the slope (β1), the shorter the individual lifespan for each of the three example (i.e., upper right and two lower panels).
