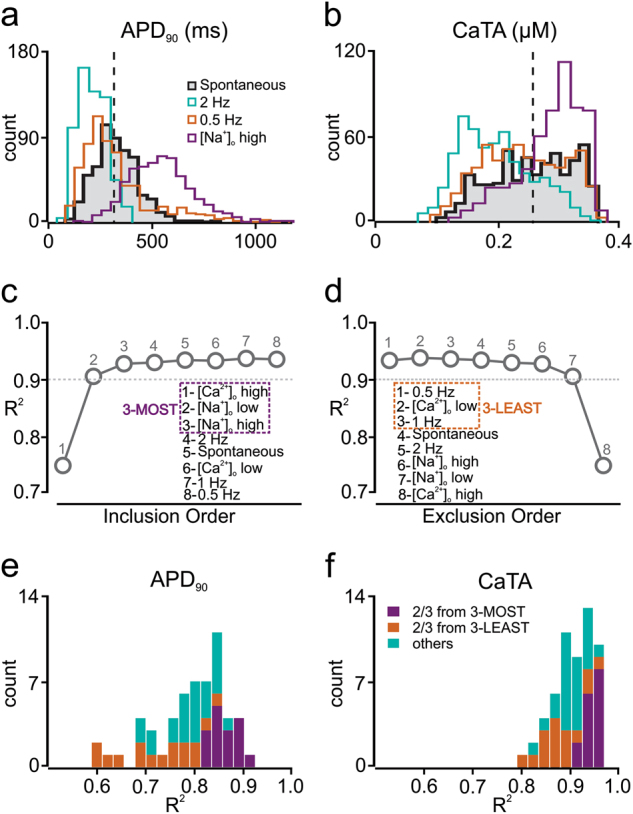
Fig. 3.

Selection of the most informative iPSC-CM simulation protocols for regression model optimization. a, b Histograms indicating how APD90 (a) and CaTA (b) vary across a heterogeneous population of iPSC-CMs under different simulated experimental conditions. The black, shaded histogram, representing population behavior with baseline spontaneous contraction is compared with alternative experimental conditions such as 0.5 Hz electrical stimulation (0.5 Hz, orange), 2 Hz electrical stimulation (2.0 Hz, green), and increased (300 mM) extracellular [Na+] ([Na+]o high, purple). c, d Averaged R2 values across all predicted features with five-fold cross-validation, with different numbers of experimental conditions for sequential inclusion (c) and sequential exclusion (d) methods. These procedures identified the three most informative protocols (3-MOST, purple dash square, left) and the three least informative protocols (3-LEAST, orange dash square, right). e, f Distributions of adjusted R2 values for APD90 (e) and CaTA (f) of the 56 regression models that can be built by randomly choosing three protocols from the initial set of eight. Regression models that select two or more protocols from the 3-MOST list (purple) exhibit better predictive power than models that select two or more protocols from the 3-LEAST list (orange)
