Fig. 3.
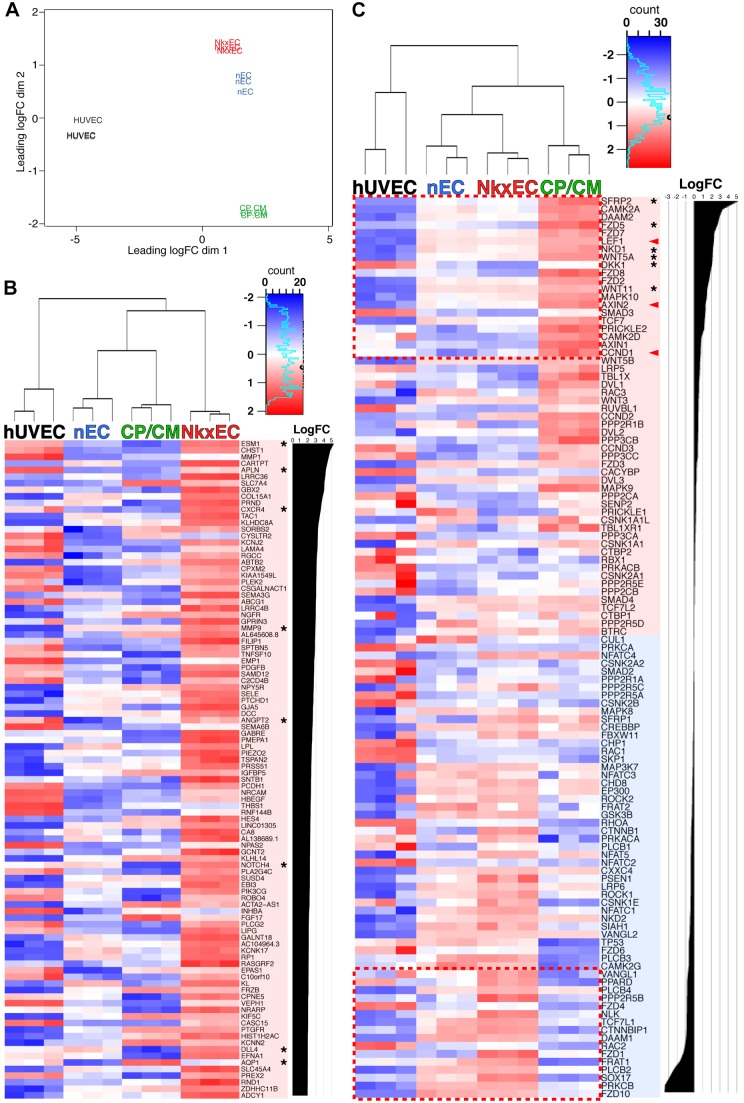
RNA-seq of NkxECs reveals reduced Wnt activation and tip cell phenotype. (A) RNA-seq was performed on biological triplicate samples of HUVECs, CP/CMs, NkxECs and nECs; an expression MDS plot showing clear differentiation between the four cell types is shown. (B) Heatmap showing the top 100 genes that were upregulated in NkxECs relative to nECs. (C) Heatmap showing a KEGG list of Wnt pathway components with transcripts listed according to log fold change (FC) of CP/CMs over NkxECs. Asterisks (B) specify genes known to be highly expressed in endothelial tip cells or (C) specify Wnt effectors known to play an inhibitory function. Arrowheads (C) specify canonical Wnt target genes. P<1×10⁻⁵ for all transcripts in B; the dashed boxes (C) shows transcripts that are significantly increased (upper) or decreased (lower) in CP/CMs relative to NkxECs (P<0.05).

