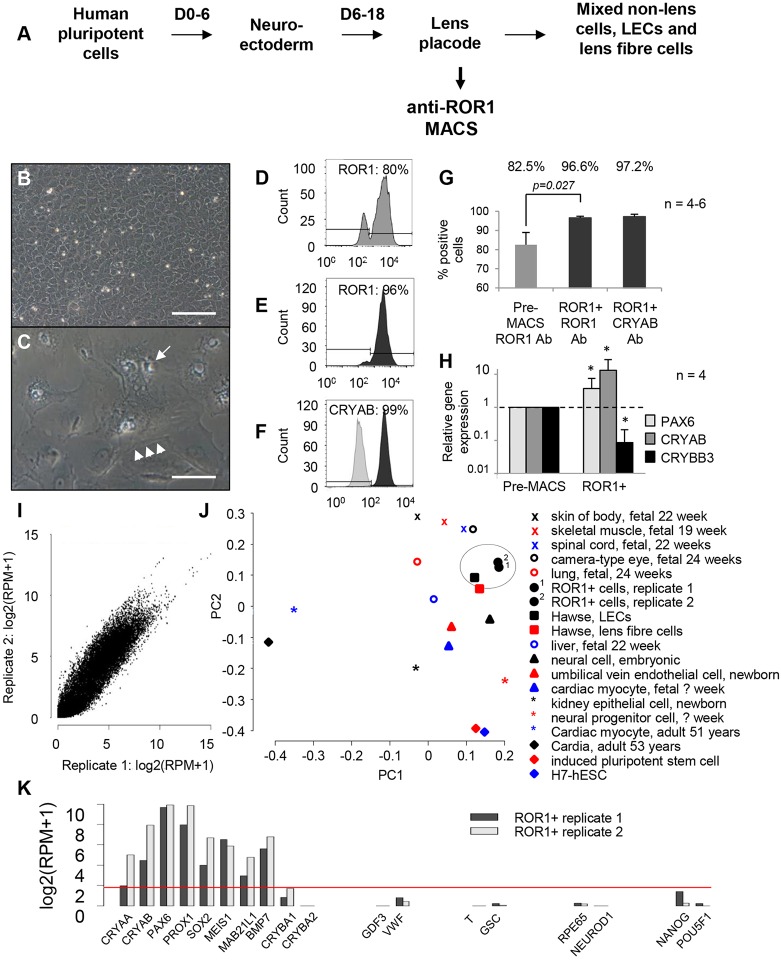
Fig. 1.
Identification and characterisation of ROR1 as a LEC marker. (A) Schematic diagram showing the three-stage lens differentiation protocol, with modification to enable ROR1-based purification of LECs. (B,C) ROR1+ cells cultured at high cell densities showed uniform polygonal morphologies that formed tightly packed monolayers (B). When cultured at low cell densities or passaged in medium containing only FGF2 (C), ROR1+ cells became large and vacuolated (arrow) with stress fibres (arrowheads; cells shown 18 days after plating; n=3). Scale bars: 100 µm. (D-G) Flow cytometry data showing expression levels of: ROR1 prior to (D) and after (E) ROR1-based purification; CRYAB after ROR1-based purification (F); and average expression levels before and after purification (G). (H) Relative mRNA transcript expression levels for PAX6, CRYAB and the lens fibre-specific gene CRYBB3 after ROR1+ cell separation (*P<0.05). (I) Pearson correlation showing high similarity (>0.96) between RNA-seq libraries generated from two independent ROR1+ cell samples. (J) Principal component analysis shows the ROR1+ RNA-seq transcriptomes are most similar to primary human LECs (circled). (K) Representative data from the ROR1+ RNA-seq libraries shows key genes required by LECs are expressed (CRYAA, CRYAB, PAX6, PROX1, SOX2, MEIS1, MAB21L1, BMP7). In contrast, genes expressed by lens fibre cells (CRYBA1, CRYBA2) or various endodermal cells (GDF3, VWF), mesodermal cells (T, GSC), non-lens ectodermal cells (RPE65, NEUROD1) and pluripotent cells (NANOG, POU5F1) are not expressed. Data shown in B,C and D-H are representative of 50 and four (respectively) independent differentiation experiments using four different hPSC lines; data are mean±s.e.m. in G,H.

