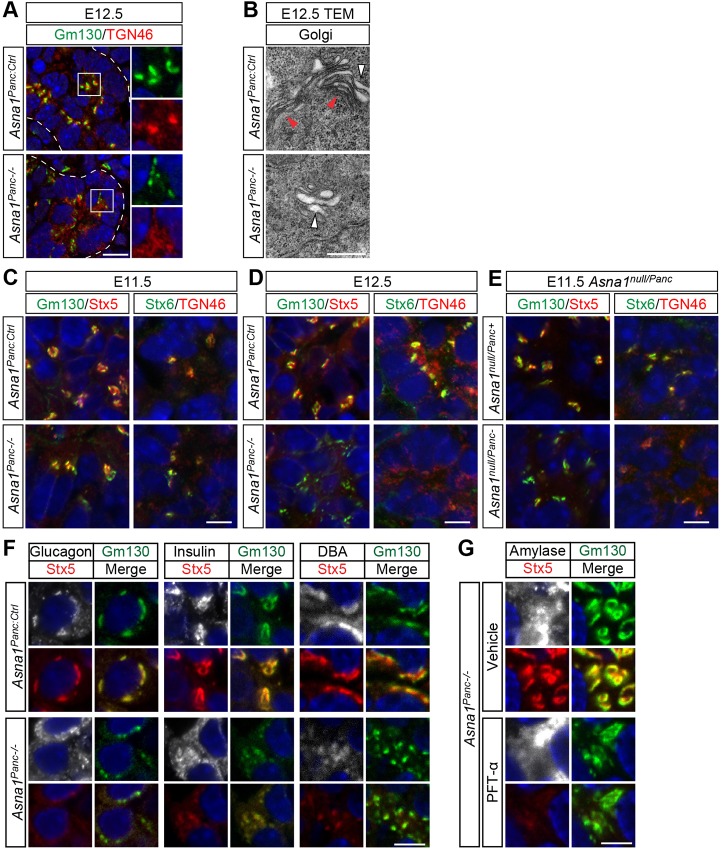
Fig. 4.
Altered morphology and Stx5 and Stx6 expression in the Golgi apparatus of Asna1Panc−/− DPE cells. (A) Immunohistochemistry of dorsal pancreatic sections from E12.5 Asna1Panc:Ctrl and Asna1Panc−/− embryos (n=3) using antibodies against Gm130 (green) and TGN46 (red). Boxed areas are shown at higher magnification on the right. (B) Transmission electron micrograph (TEM) of dorsal pancreatic sections from E12.5 Asna1Panc:Ctrl and Asna1Panc−/− embryos (n=3) showing compact Golgi stacks (red arrowheads) and distended Golgi stacks (white arrowheads). (C-E) Immunohistochemistry of dorsal pancreatic sections from E11.5 (C,E) or E12.5 (D) Asna1Panc:Ctrl and Asna1Panc−/− embryos (n=3) (C,D) or Asna1null/Panc+ and Asna1null/Panc− (E) embryos (n=3), using antibodies against Gm130 (green), Stx5 (red), Stx6 (green) and TGN46 (red). (F) Immunohistochemistry of dorsal pancreatic sections from E16.5 Asna1Panc:Ctrl and Asna1Panc−/− embryos (n=3) using antibodies against Stx5 (red) and Gm130 (green) together with either glucagon, insulin or DBA-lectin (all white). Merge panels show co-expression between Stx5 and Gm130 (yellow). (G) Immunohistochemistry of dorsal pancreas explants from E10.5 Asna1Panc−/− cultivated for 5 days (n=3) exposed to vehicle or PFT-α, using antibodies against Stx5 (red) and Gm130 (green) together with amylase (white). Merge panels show co-expression between Stx5 and Gm130 (yellow). DAPI (blue) indicates nuclei in A,C-G. Scale bars: 50 µm in A; 0.5 µm in B; 10 µm in C-E; 5 µm in F,G.

