Fig. 5.

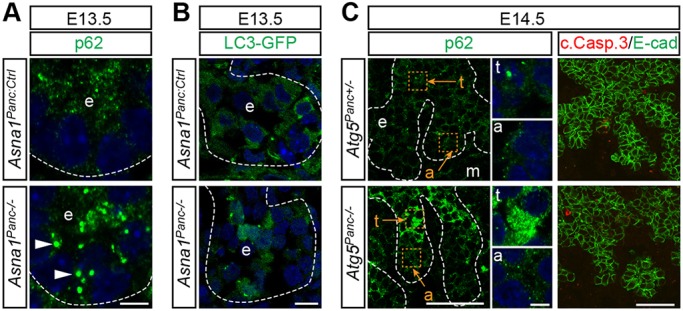
Accumulation of autophagy markers in Asna1Panc−/− DPE. (A) Immunohistochemistry of dorsal pancreatic sections from E13.5 Asna1Panc:Ctrl and Asna1Panc−/− embryos (n=5) using antibodies against p62 (green). Arrowheads indicate p62+ puncta. (B) Dorsal pancreatic sections from E13.5 Asna1Panc:Ctrl and Asna1Panc−/− embryos on a LC3-GFP transgenic background, showing LC3-GFP fluorescence in green (n=2). (C) Immunohistochemistry of dorsal pancreatic sections from E14.5 Atg5Panc+/− and Atg5Panc−/− embryos (n=3), using antibodies against p62 (green), E-cadherin (E-cad; green) and cleaved caspase3 (c.Casp.3; red). Insets show magnification of selected trunk (t) and acinar (a) epithelia areas (orange squares, letters and arrows). DAPI (blue) indicates nuclei in A-C. Dashed lines delineate pancreatic epithelium (e) and mesenchyme (m). Scale bars: 5 µm in A,B and insets in C; 50 µm in C. All image pairs were captured using the same settings.
