Fig. 4.
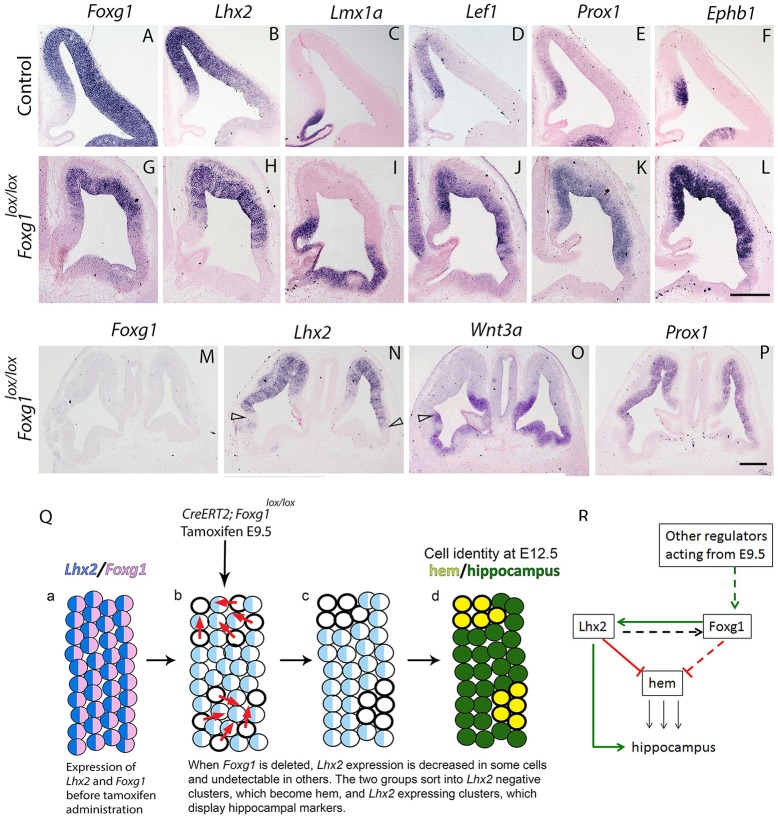
Ectopic hippocampal markers appear adjacent to the ectopic hem. (A-F) Control brains at E12.5 display hippocampal primordium markers Lef1, Prox1 and Ephb1 in neuroepithelium that also expresses Foxg1 and Lhx2. (G-P) Tamoxifen was administered at E9.5 to CreERT2; Foxg1lox/lox embryos, and brains were harvested at E12.5. (G) Foxg1 expression is present in dorsal regions that escaped recombination, but not in ventral regions. (H) Lhx2 displays a similar pattern to FOXG1. (I) Ectopic hem identified by Lmx1a expression is seen in regions devoid of Foxg1 and Lhx2. (J-L) The hippocampal primordium markers Lef1, Prox1 and Ephb1 are seen in tissue that excludes the ectopic hem and expresses Foxg1 and Lhx2. (M-P) Another brain with complete recombination of Foxg1 (M) and reduced expression of Lhx2 (N). In the complete absence of Foxg1, ectopic hem is seen only regions lacking Lhx2 expression (arrowheads, N,O) and hippocampal marker Prox1 appears only in regions displaying Lhx2 expression. Scale bars: 200 µm. (Q) Summary schematic. (a) Cortical neuroepithelial cells express Foxg1 (pink) and Lhx2 (blue). (b-d) Removal of Foxg1 by tamoxifen administration at E9.5 causes a decrease in Lhx2 expression in some cells (light blue) and complete loss of Lhx2 in some cells (open circles). Lhx2-negative cells cluster together (red arrows, b) and transform into hem (yellow, d), whereas Lhx2-expressing cells also cluster together, and express hippocampal markers when they lie adjacent to the hem patches (green, d). This provides a molecular basis for the Foxg1 mutant phenotype in which only hem and hippocampal fates are seen. (R) Model of interactions. Solid red and green lines indicate interactions based on data in this study. Broken red and green lines represent regulatory effects hypothesized based on data in this study, and the dashed black line represents a predicted regulation of Foxg1 by LHX2 in the medial telencephalon, based on data from Mangale et al. (2008). Black lines indicate inductive effects.

