Fig. 6.

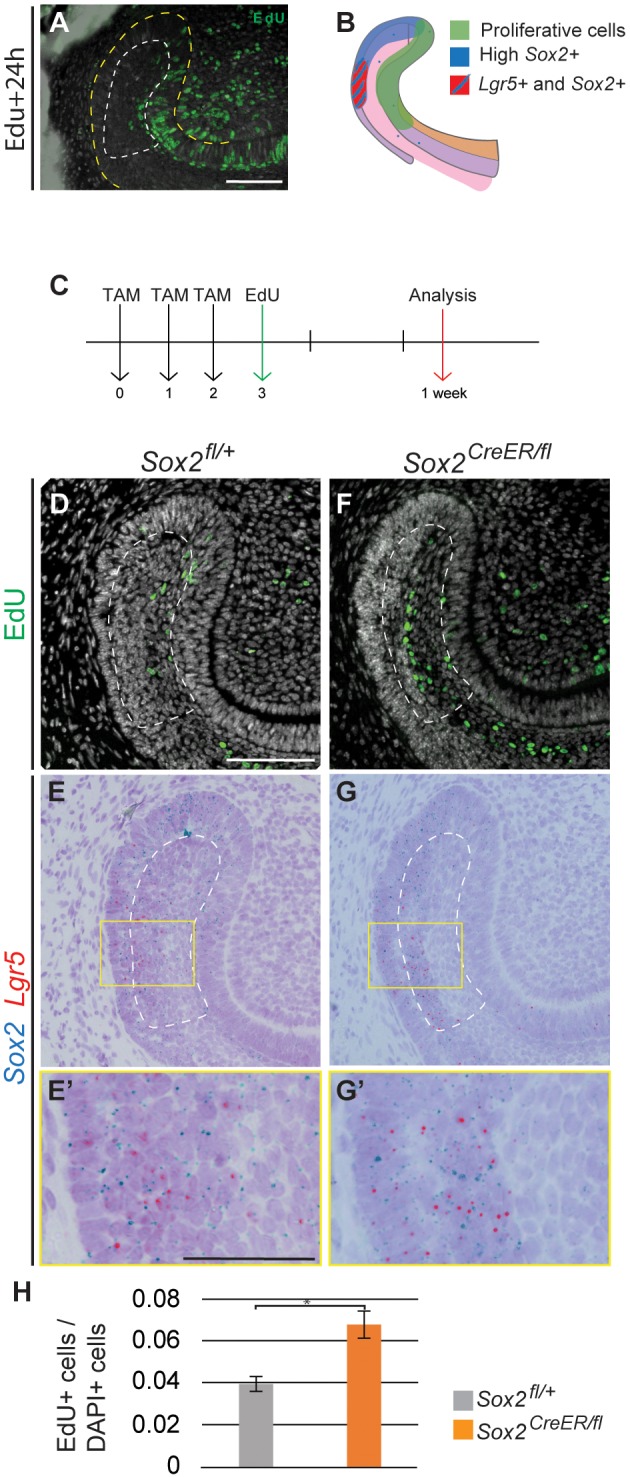
Expression of Sox2 and Lgr5 is rescued from the SR. (A) Pattern of proliferative cells (EdU+) 24 h after being administered to the mouse. (B) Schematic representation of the proliferative region and the Sox2+ and Lgr5+ domains. (C) The experimental setup. EdU+ cells (D,F) and Sox2 and Lgr5 mRNA detection (E,G) performed in identical sections. (E′,G′) Higher magnifications of the boxed regions in E,G. (H) Quantification of EdU+ cells in the SR of control and Sox2CreER/fl mice. The area quantified is delineated by the dashed line in D-G. Results are expressed as the fraction of EdU+ cells among total cells (number of nuclei, DAPI) compared with the control. *P=0.007. Scale bars: D-G, 100 µm; E′,G′, 50 µm.
