Fig. 1.
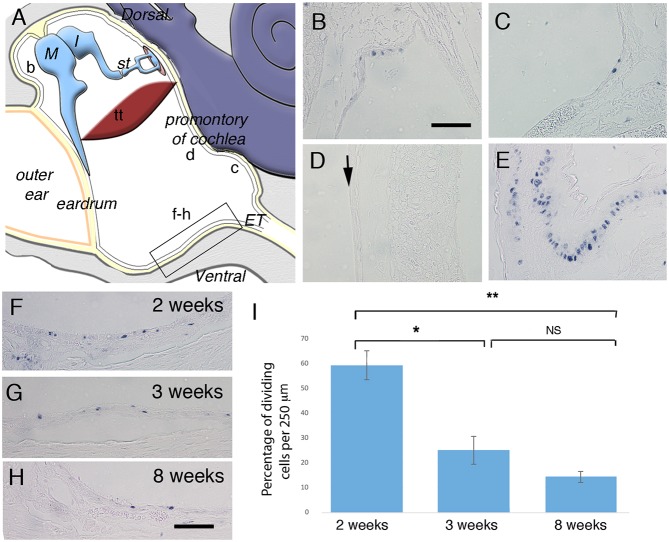
Proliferation in distinct parts of the postnatal middle ear epithelium. (A) Schematic illustrating the middle ear cavity with b-d,f-h showing the position of B-D,F-H. The boxed region in A shows the area used for cell counts. (B-H) Frontal sections immunostained for PCNA. (B) Dorsal to eardrum. (C) Close to Eustachian tube. (D) Promontory over cochlea. Arrow indicates negative middle ear epithelium. (E) Proximal trachea epithelium. (F-H) Ventral epithelium showing the position of cell counts at 2 weeks (F), 3 weeks (G) and 8 weeks (H). (I) Graph showing average proliferating cell density in the hypotympanum (per 250 µm) at 2 (n=3 ears), 3 (n=3 ears) and 8 (n=3 ears) weeks. Error bars indicate s.e.m. *P<0.05, **P<0.005; NS, not significant. Student's unpaired t-test. M, malleus; I, Incus; st, stapes; tt, tensor tympani; ET, Eustachian tube. Scale bars: 100 µm in B-H.

