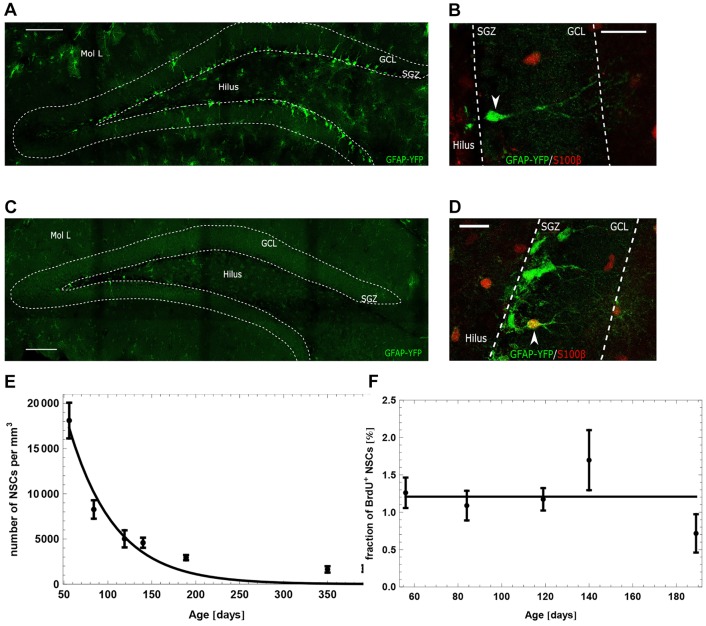
Fig. 2.
GFAP-YFP-expressing cells in the DG and population-level dynamics of hippocampal neural stem cells. (A,C) GFAP-YFP-positive cells in 8-week-old (A) and 56-week-old (C) GFAP-YFP reporter mice. Scale bars: 100 μm. (B,D) Representative confocal images of immunostaining for GFP (green) and S100β (red). Shown are examples of a GFAP+/S100β− neural stem cell (B) and a GFAP+/S100β+ astrocyte (D). Scale bars: 20 μm. (E,F) Fit of the proposed model to the total number of NSCs (E) and the fraction of BrdU-incorporating NSCs (F). Estimated parameters are displayed in Table 1.

