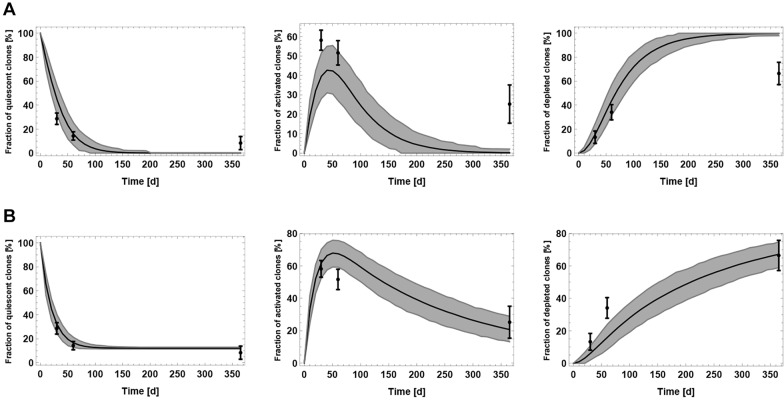
Fig. 3.
Comparison of the proposed model with the clonal data of Bonaguidi et al. (2011). Results are obtained by simulating 100 NSC clones 1000 times. Simulation data are represented as mean (solid black line) and a band containing 95% (gray) of all simulated trajectories. Black error bars correspond to the clonal data. Estimated parameters are displayed in Table 1. (A) Simulation of the stochastic counterpart of model (2.1) using the parameters of the population-level fit displayed in Fig. 2. (B) Fit of the stochastic counterpart of model (2.1) by estimating model parameters.

