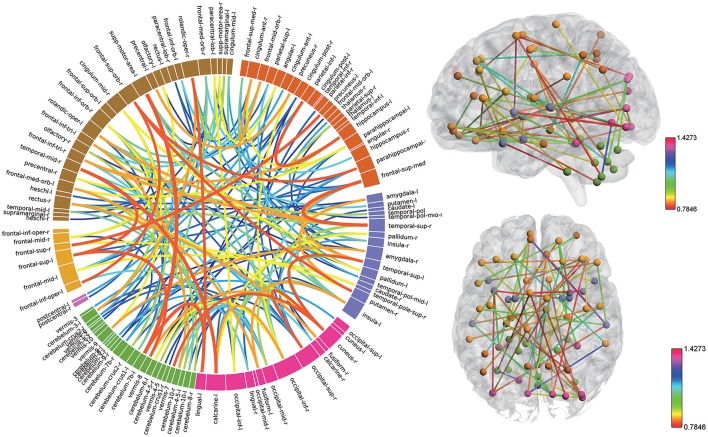
Figure 4.
The ranking of regions weight and feature weight from classifiers of whole functional connectivity analysis using AAL template. In the left panel, the box in the ring represents brain regions and line connect two boxes represents functional connectivity of the two brain regions. Box size represents the size of the weight of brain regions. Color and z-depth of the line represents the size of the weight. In the right panel, small ball represents brain regions whose different colors means they belongs to different resting-state networks. Lines connect two small ball represents functional connectivity of two brain regions and its color represents the size of its weight.

