Figure 3.
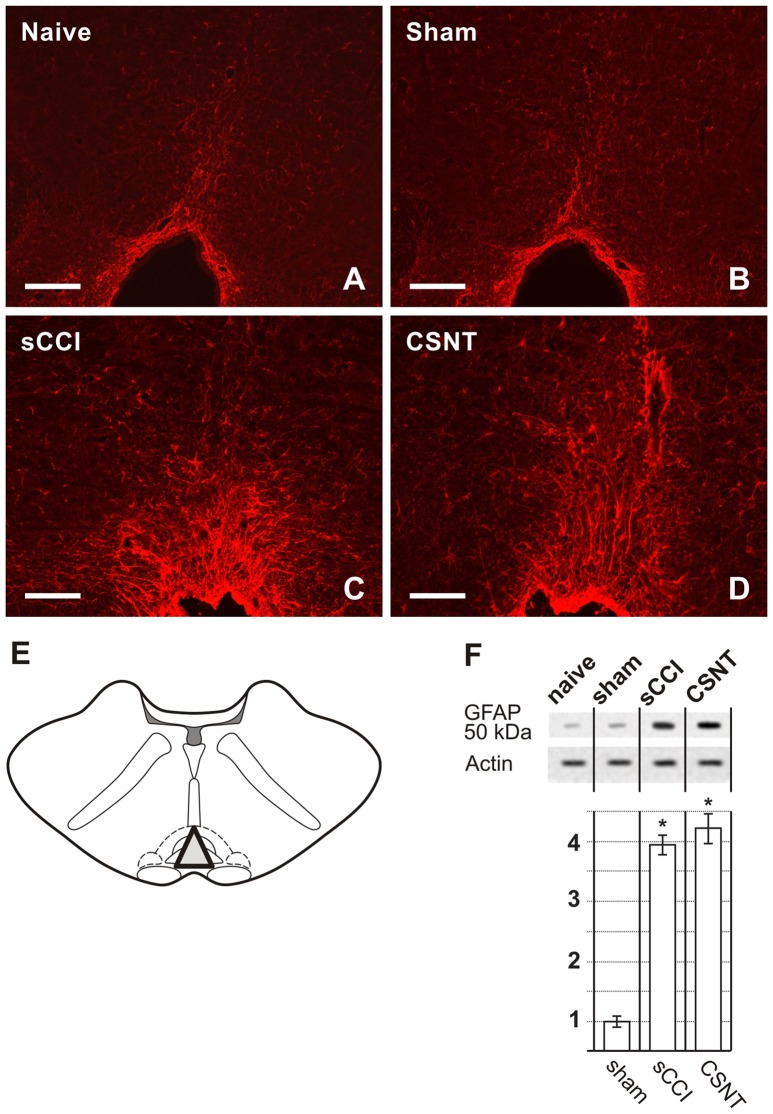
Representative medullary sections showing rostral ventromedial medulla (RVM) from naïve and sham-operated controls (A,B) and 3 weeks after sCCI or CSNT (C,D). The pictures illustrate increased intensity and expansion of GFAP immunostaining in RVM after sCCI and CSNT in comparison to RVM from naïve or sham-operated rat. Scale bars = 90 μm. (E) The drawing illustrates dissection of RVM samples for western blots including the nucleus raphe magnus and gigantocellularis pars alpha (triangle). (F) The top panel illustrates representative western blot of GFAP protein in RVM of naïve and sham-operated rats and 3 weeks after sCCI or CSNT. *Indicates a statistically significant difference (p < 0.05) compared to the value from sham-operated rats.

