Figure 5.
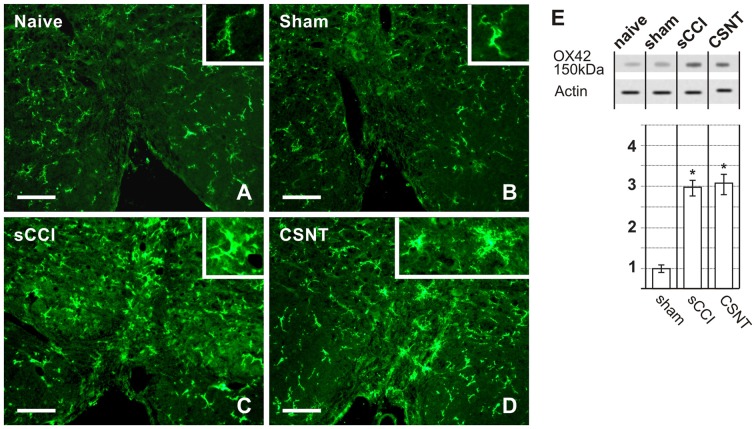
Representative medullary sections showing RVM from naïve and sham-operated controls (A,B) and rats with sCCI or CSNT (C,D). The pictures illustrate increased intensity and enlargement of OX42 immunostaining after sCCI and CSNT when compared to RVM from naïve or sham-operated rats. Insets show the typical morphological types of OX42+ microglial cells from the respective animal groups. Scale bars = 40 μm. (E) Western blot analysis of OX42 (CD11b/c) protein. The top panel illustrates representative western blot in RVM of naïve and sham-operated rats and rats 3 weeks after sCCI or CSNT. Graph below the blot illustrates density data obtained from three blots after normalization to actin, expressed as fold-change relative to those of sham-operated rats (set as 1). *Indicates a statistically significant difference (p < 0.05) compared to the value from sham-operated rats.

