
Figure 3.
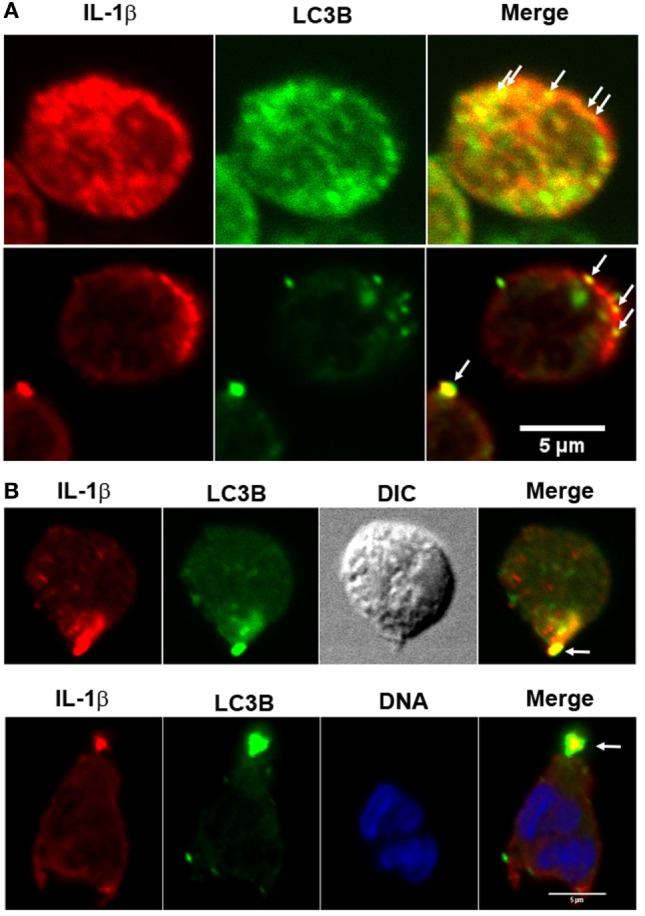
Fluorescence distribution of interleukin-1β (IL-1β) and LC3B in LPS + ATP-stimulated neutrophils. Neutrophils were fixed at 4 h post-LPS stimulation, permeabilized, and stained with specific antibodies anti-IL-1β (red) and LC3B (green). Blue signal represents DNA stained with TO-PRO-3. Images were acquired with a confocal microscope. Arrows indicate compartments with overlapping fluorescent signals near the cell membrane (A) and in a cell pole (B). Images are representative of experiments with 10 different donors.