
FIGURE 1.
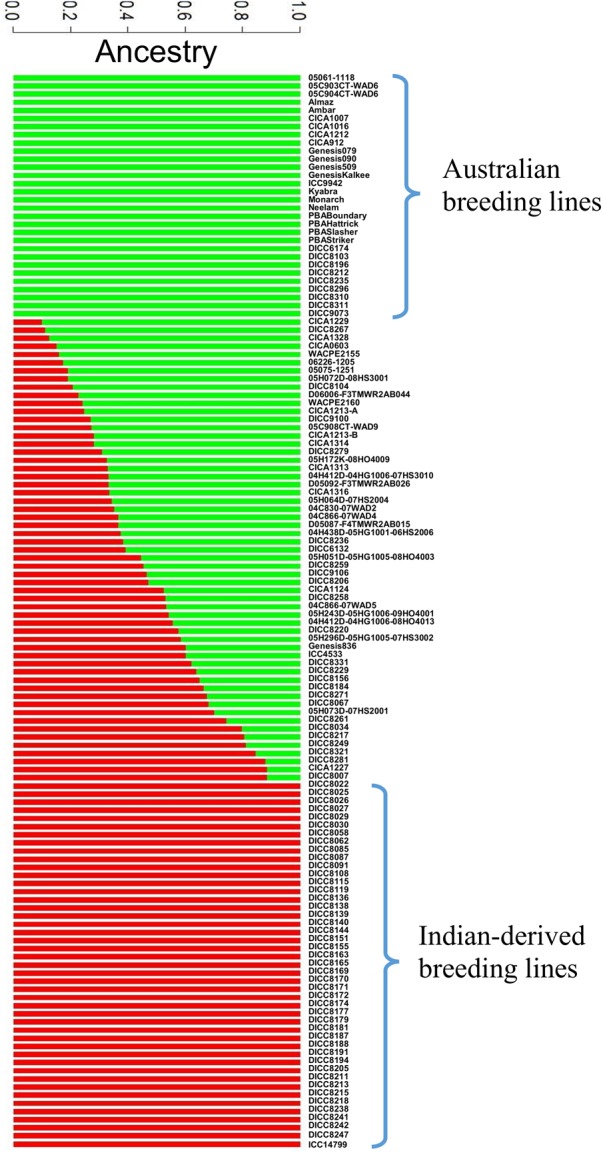
Population structure diagrams of the 132 genotypes. Results of population structure are shown when the numbers of estimated clusters is k = 2. The vertical bar is partitioned into red and green segments that represent the genotype’s estimated membership fractions.