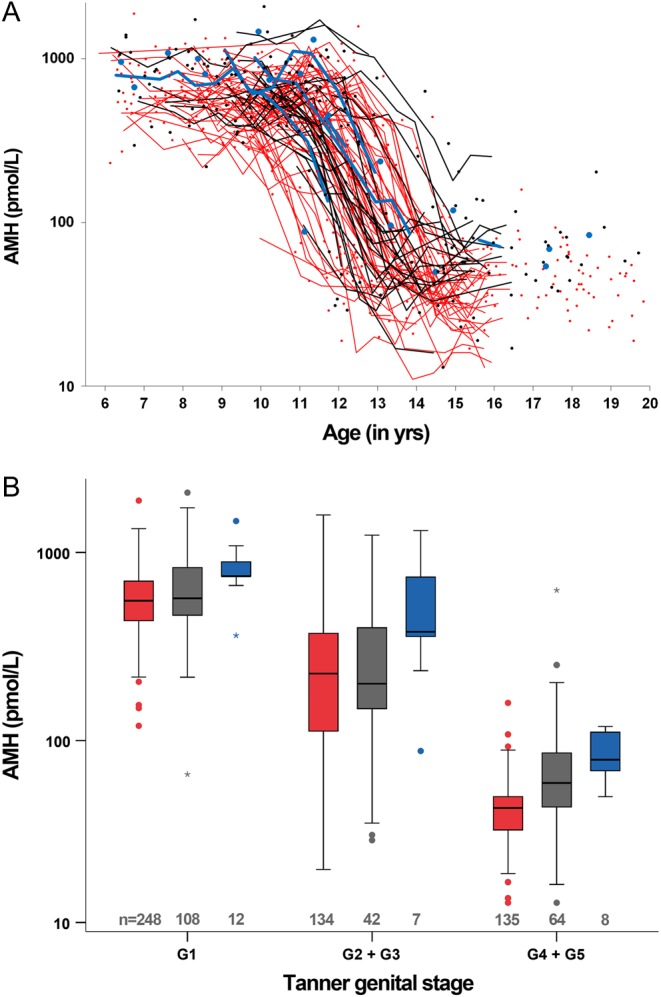
Figure 1.

Boys. (A) Serum AMH levels according to age stratified by AMH rs10407022 T>G, TT red; TG black; GG blue. (B) Serum AMH levels according to Tanner subgroups stratified by AMH rs10407022 T>G, TT red; TG black; GG blue. If multiple observations within a specific Tanner subgroup were available for the same boy, a mean value was calculated. In the boxplots medians are marked by thick black lines; boxes contain 50% of the distribution. Whiskers mark 2.5th–97.5th percentile.

 This work is licensed under a