Figure 1.
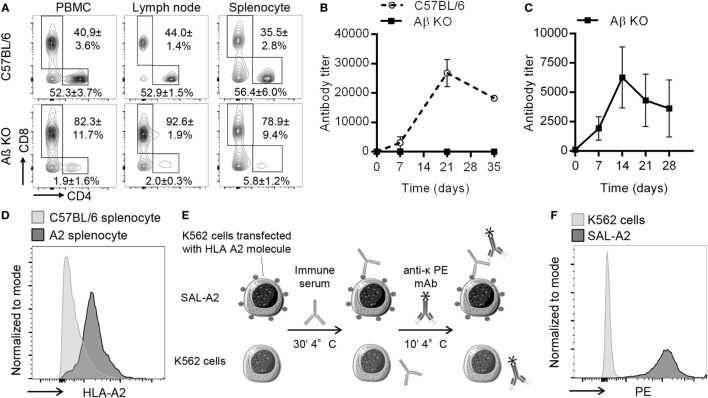
Presentation of experimental model. (A) Representative flow cytometry profiles of CD3+ T cells in PBMC and secondary lymphoid organs is shown for wild-type C57BL/6 (upper row) and AβKO (lower row) mice. Mean and SD from analysis of 10 animals of each strain are indicated for the % of CD4+ and CD8+ T cells. (B) Evolution over time of anti-NP IgG titer (mean ± SD) after immunization with the thymo-dependent model antigen NP-KLH is shown for wild-type C57BL/6 (n = 3, dashed line) and AβKO (n = 3, black line). (C) Anti-NP antibody titer was measured by ELISA in the circulation of AβKO mice (n = 3) before and every 7 days postimmunization with the thymo-independent model antigen NP-dextran (mean ± SD). (D) Splenocytes from C57BL/6 (negative controls) and HLA A2 transgenic mice were incubated with fluorescent-conjugated mice anti-human HLA I monoclonal antibody (mAb) (W6/32). Representative flow cytometry histograms are shown. (E) To quantify donor specific antibody (DSA), diluted sera were incubated with K562 or single antigen expressing cell line (SAL)-A2 for 30 min at 4°C. Cells were washed and incubated with a phycoerythrin (PE)-conjugated anti-light chain mAb before measurement of PE mean fluorescence intensity by flow cytometry. Anti-A2 antibody titer was normalized as explained in Section “Materials and Methods.” The normalized DSA titer reflects the fold increases of specific signal over the baseline. (F) Representative examples of cytometry profiles obtained after incubation of K562 and SAL-A2 with an anti-A2 immune serum are shown.

