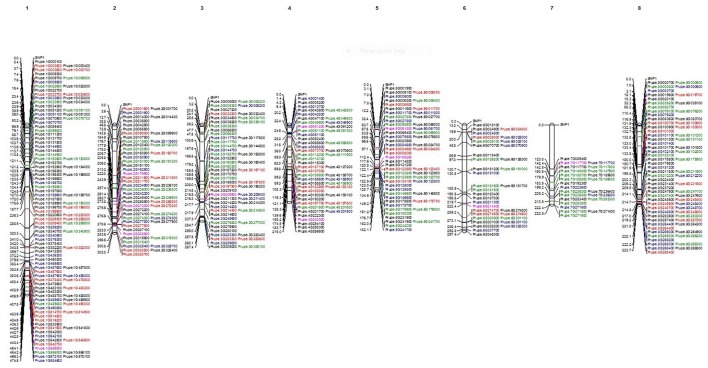
Figure 2.
Physical map of Japanese plum using the filtered SNPs, INDELS and the 12 candidate genes highly associated to ethylene and sorbitol response. In black all the SNP found to be different between Santa Rosa and the rest of cultivars. In blue are shown the SNP where Santa Rosa are different to Sweet Mariam. In green all the SNP that confer differences between the climacteric and non-climateric cultivars. In red are shown all the INDELS found to be different between Santa Rosa and Sweet Mariam. In purple, are show the 12 candidate genes for ethylene and sorbitol response.

