Fig. 4.
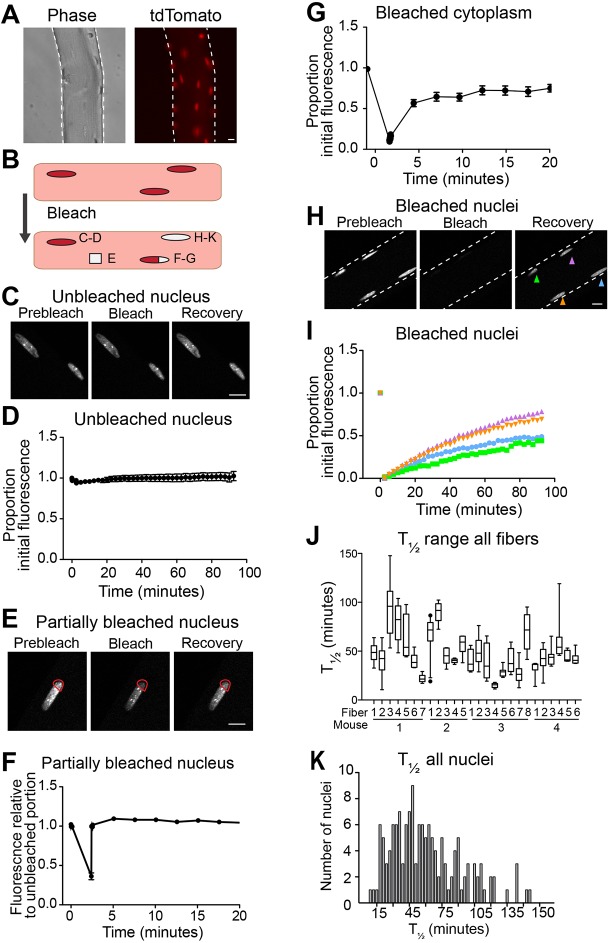
cNLS nuclear import varies among nuclei within single myofibers. (A) Myofibers isolated from gastrocnemius muscles of mice constitutively expressing nuclear-targeted cNLS–tdTomato exhibit strong nuclear fluorescence and minimal cytoplasmic fluorescence. (B) Schematic representing the cellular parameters that were studied in FRAP experiments: an unbleached nucleus, a partially bleached nucleus, a bleached portion of cytoplasm and a fully bleached nucleus. (C) Representative images of unbleached nuclei at different times points. (D) Unbleached nuclei consistently maintained fluorescence throughout the entire period of imaging (n=33, mean±s.e.m.). (E) Representative partially bleached nucleus prior to bleaching, immediately after bleaching and after recovery. Red outlines the bleached area. (F) Bleached sections of partially bleached nuclei rapidly recover to baseline fluorescence (n=11, mean±s.e.m.). (G) Regions of bleached cytoplasm rapidly recover to their initial fluorescence (n=19, mean±s.e.m.). (H) Representative bleached nuclei prior to bleaching, immediately after bleaching and after recovery. (I) The time to half recovery (T1/2) of four bleached nuclei within a single myofiber differ from one another, as calculated by quadratic regression. (J) The median and range of T1/2 of nuclei greatly vary among myofibers, indicating differences in the rate of cNLS import among nuclei, both within a myofiber and among myofibers (4–8 nuclei measured per myofiber). (K) The histogram of T1/2 of bleached nuclei reveals a continuous broad population with median T1/2 of 45 min (n=128). Scale bars: 10 µm.

