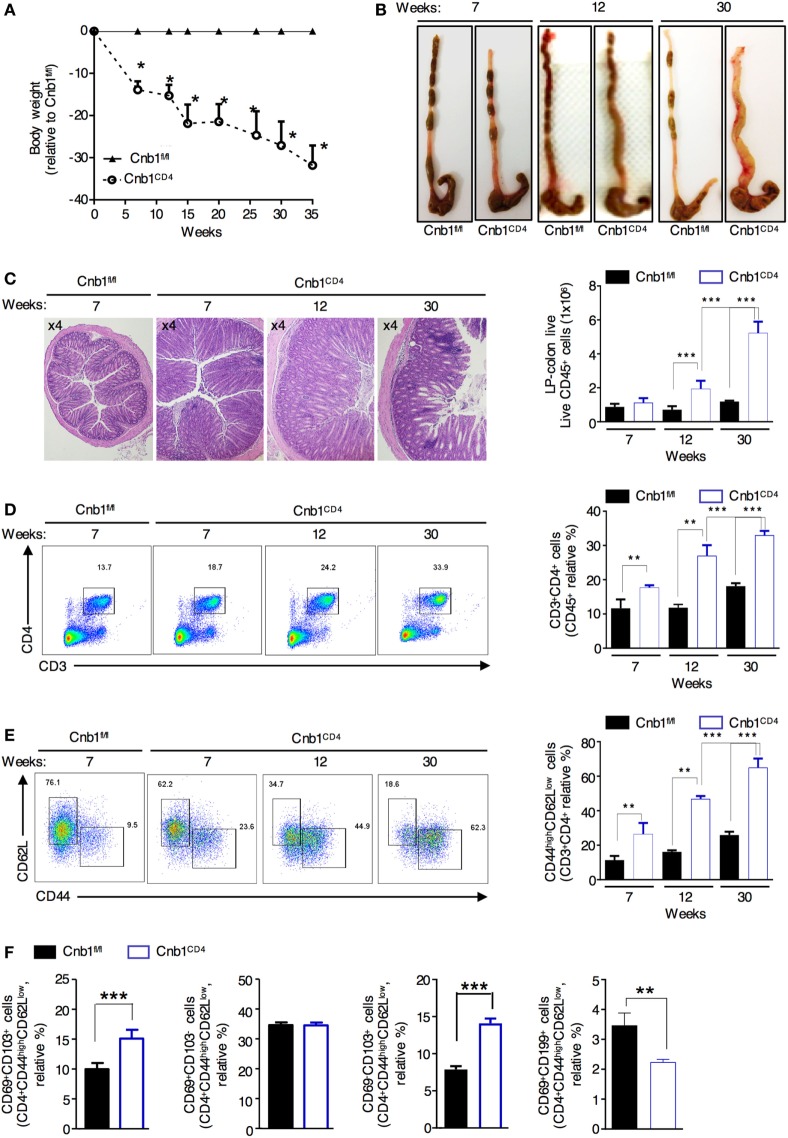
Figure 2.
Cnb1CD4 mice develop spontaneous colitis. (A) Body weight was measured in Cnb1CD4 and Cnb1fl/fl mice for 35 weeks and expressed as the weight variation relative to the weight of Cnb1fl/fl control mice. (B) Representative macroscopic observations of the colons of Cnb1CD4 and Cnb1fl/fl mice aged 7, 12, and 30 weeks. (C) Representative histopathologic analysis of the colons stained with hematoxylin and eosin taken from Cnb1CD4 mice aged 7, 12, and 30 weeks. Colons are shown at ×4 magnification together with the number of infiltrating leukocytes (far right). (D,E) Flow-cytometric analyses showing the proportions of (D) CD3+CD4+ T cells and (E) CD44highCD62Lneg cells among CD4+ T cells in the colonic-LP of Cnb1CD4 and Cnb1fl/fl mice. Data represent the means ± standard error of four independent experiments (n = 4–5 mice per group, per experiment). **P < 0.01; ***P < 0.005 (two-tailed, unpaired Student’s t-test). (F) Proportion of CD44high CD4+ T cells expressing CD69 alone or in combination with CD103 or CD199+ CD4+ T cells from the colonic-LP of Cnb1fl/fl and Cnb1CD4 mice aged 6–8 weeks. Data represent the means ± standard error of two independent experiments (n = 2–3 mice per group, per experiment) ***P < 0.005 (ANOVA followed by Tukey’s Multiple Comparison Test). Abbreviation: LP, lamina propria.

