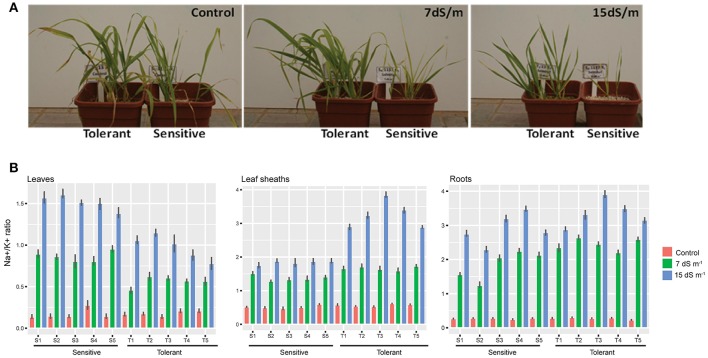
Figure 2.
Na+ measures in different barely tissues. (A) A photograph of barely plants tolerant and sensitive subjected to Control, 7 and 15 ds m−1. (B) Five tolerant and five sensitive barely plants subjected to 7 and 15 ds m−1 compared to a control. Measures of Na+ in Leaf, leaf sheath and roots shown in barplot with mean ± standard error (P < 0.05), in salt tolerant and sensitive compared to control are shown.

