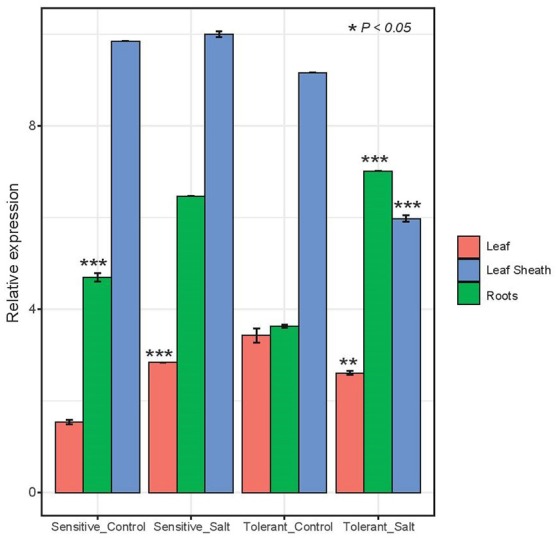
Figure 4.

Expression analysis of HKT 1;5 by real time RT-PCR. Amplification of RNA from leaf, leaf sheath and root tissues of two barley salt tolerant and two salt sensitive lines. Sampling was done in triplicates after 48 h of growing the plants under salt stress condition (200 mM NaCl). A house keeping gene actin from barely was used for control and the data was normalized to 0 mM NaCl. The range of expression level (means ± SD, n = 3 biological replicates) in each line and tissue was analyzed with a t-student test and significance was reported (*P < 0.05; **P < 0.005; ***P < 0.0005).
