FIGURE 2.
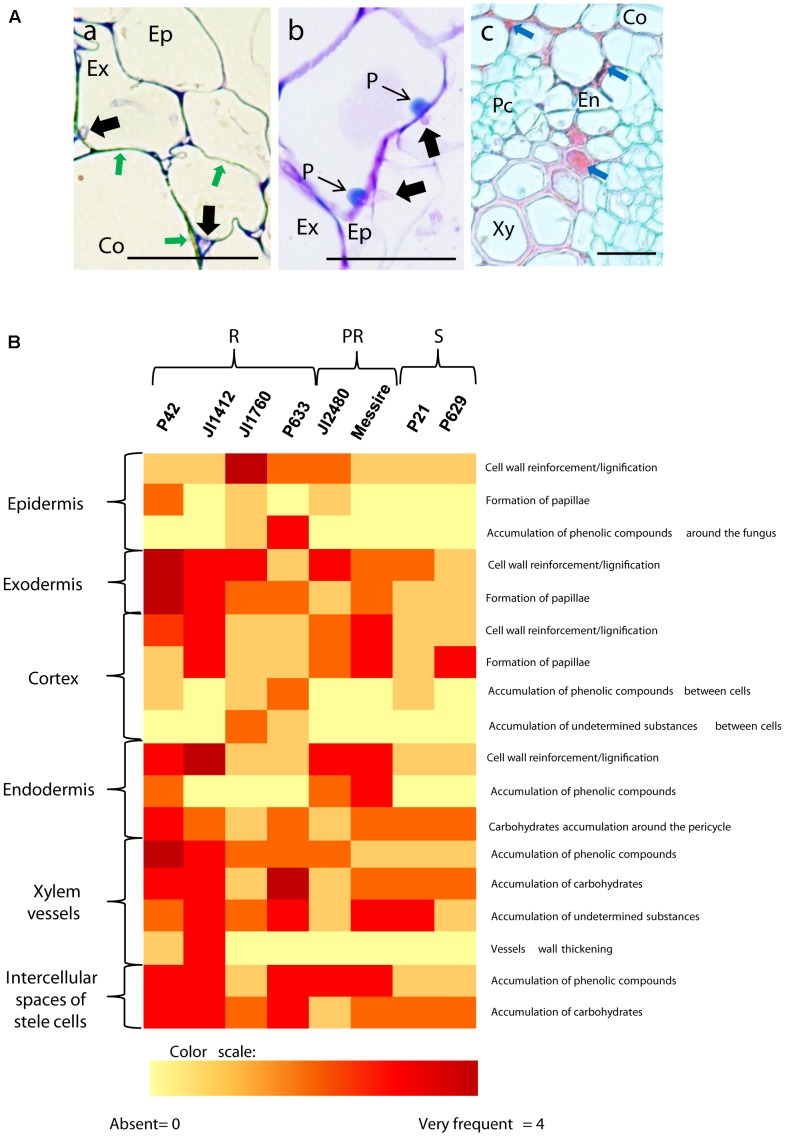
Description and frequency of resistance mechanisms detected in pea cells. (A) Cross sections of inoculated pea roots of resistant accessions illustrating the main mechanisms of resistance detected in pea. (a) TBO stained cross-section of inoculated root of the resistant P42 at 7 dpi showing the strengthening of cortical cell wall through lignification (Green arrows). (b) TBO stained cross-section of inoculated root of the resistant P42 at 7 dpi showing the apposition of defensive papilla preventing cell penetrations. (c) AGS stained cross-section of inoculated root of the resistant accession P42 at 7 dpi showing accumulation of undetermined substance in the intercellular space and within cells (Blue arrows). Black arrows indicate fungal cell presence. Bars = 25 μm. Ep, epidermis; Ex, exodermis; En, endodermis; Co, cortex; Xy, xylem cells; Pc, parenchyma cells. (B) Heatmap summarizing the frequency of host cell reactions observed 7 days after Fop inoculation in the different accessions at each root tissue. Intensity range from yellow (0 = absent reaction) to dark red (4 = very frequent) according to a visual scale ranging from 0 to 4 with 0 = absence of reaction, 1 = rare: reaction observed in less than 10% of the analyzed sections, 2 = low frequency: <30%, 3 = frequent: <60% and 4 = high frequency: >60%. R, resistant accessions; PR, partially resistant accessions; S, susceptible accessions.

