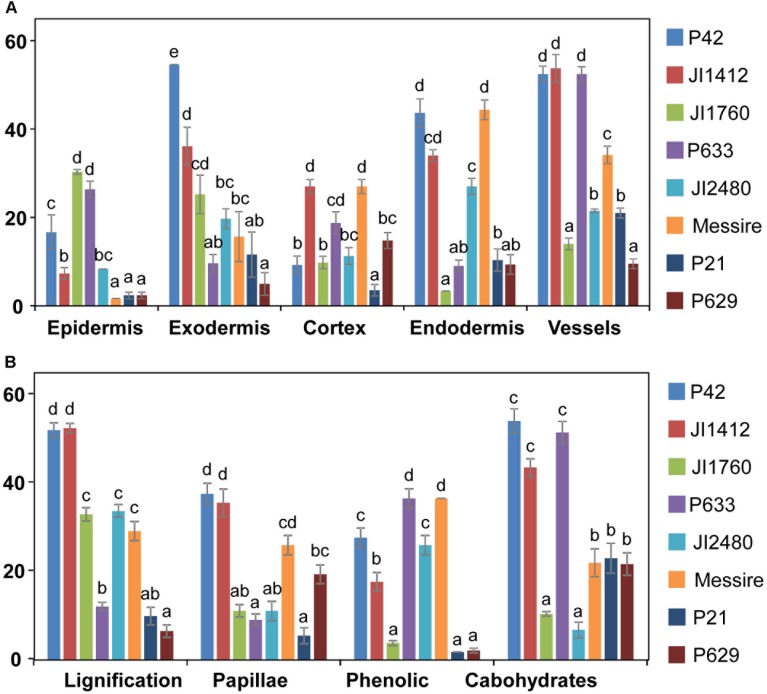
FIGURE 6.
Relevance of tissue and resistance responses in the defense strategy of pea against F. oxysporum. Data compare the frequency of overall resistance responses at each root tissue (A) and frequency of each defense reaction (B) between pea accessions with different levels of resistance to F. oxysporum. Vertical bars are standard errors for n = 10. Different letters indicate significant differences at p < 0.05 according to Tukey’s range test.

