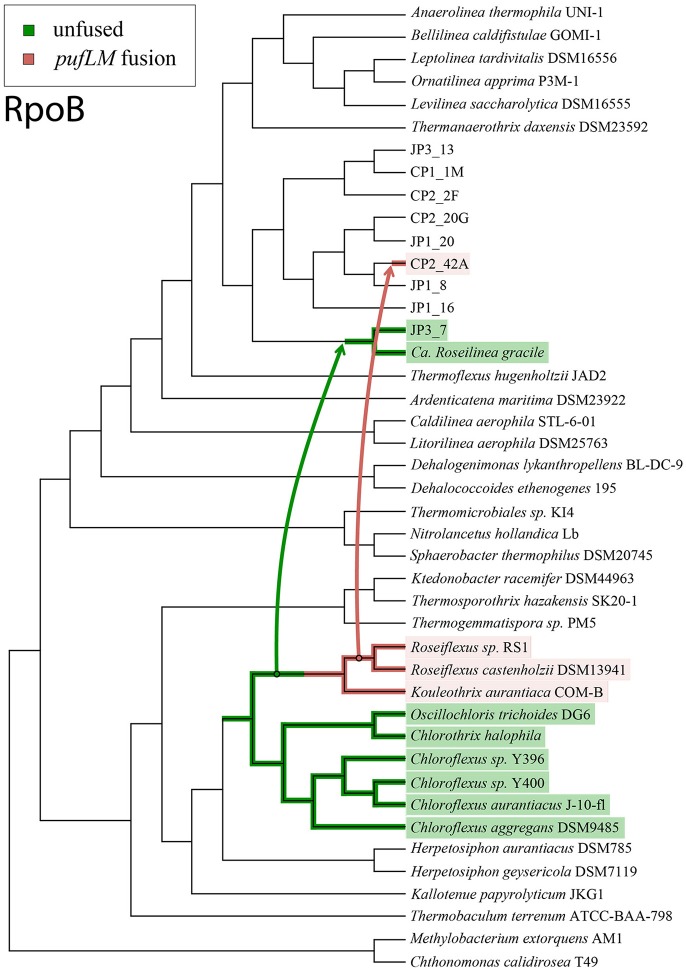
Figure 3.
Cladogram of the Chloroflexi phylum based on RpoB protein sequences, illustrated with the simplest possible evolutionary history of phototrophy that honors the relationships between the reaction center proteins and organismal markers. Non-phototrophic lineages are shown in black, lineages with fused pufLM reaction center genes are highlighted in pink, and lineages with unfused reaction center genes are shown in green. Arrows mark the inferred horizontal gene transfers of phototrophy genes. The most parsimonious scenario for the evolution of phototrophy within the Chloroflexi requires two separate horizontal gene transfer events, and a single gene fusion of pufLM.

