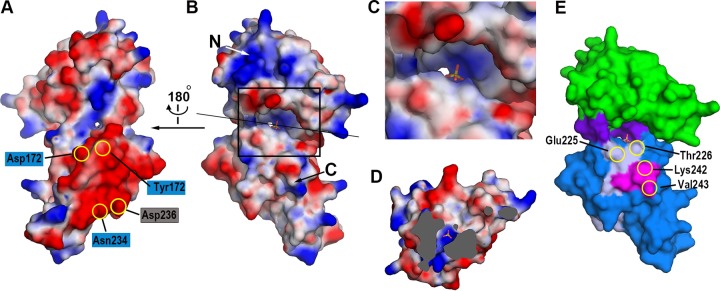
FIG 4.
The cleft and groove of NisI22-C. The distribution of the electrostatic potentials of NisI22-C. The potentials are shown in the range of −80 kT/e (red, negative potential) to + 80 kT/e (blue, positive potential). The views are from the shallow groove (A) and from the deep cleft (B). The residues involved in the interaction with nisin (in blue rectangles) and residues belonging to the C-terminal 21-amino-acid fragment (in gray rectangle) are shown on the negative patch of the C-terminal domain. The orientation of the surface diagram in (B) is almost identical to that of Fig. 2A. The sulfate ion is also shown in the stick model. (C) Zoomed-in view of the deep cleft. The region marked with the rectangle in (B) is magnified. (D) View of cross section after clipping the molecules along the straight black line as in (B). The view is facing the N-terminal domain. The solvent-inaccessible areas are shown in gray. The sulfate ion and the water molecule below the sulfate ion are shown with the stick model and the green sphere, respectively. (E) The distribution of residues critical for the immunity. Residues belonging to the C-terminal 21-amino-acid fragment (light gray) and the C-terminal 5-amino-acid fragment (magenta), which is also a part of the C-terminal 21-amino-acid fragment, are plotted on the surface model of NisI22-C using the same color scheme as in Fig. 2A.

