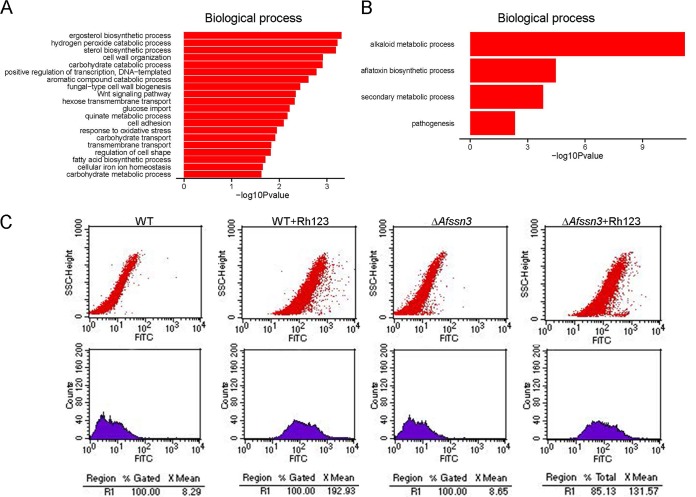
FIG 8.
Afssn3 inactivation increased the activity of efflux pumps. (A and B) Histogram of the upregulated pathway (A) and the downregulated pathway (B) −log(P = 10) values enriched in ΔAfssn3 based on a GO functional enrichment analysis. (C) Rh123 accumulation is reduced in strain ΔAfssn3. Rh123 accumulation was measured by flow cytometry. The fluorescein isothiocyanate (FITC) at the x axis represents the relative value of fluorescence intensity and side scatter-high (SSC-H) at the y axis, which was the relative value of the light scattering intensity in A. fumigatus.

