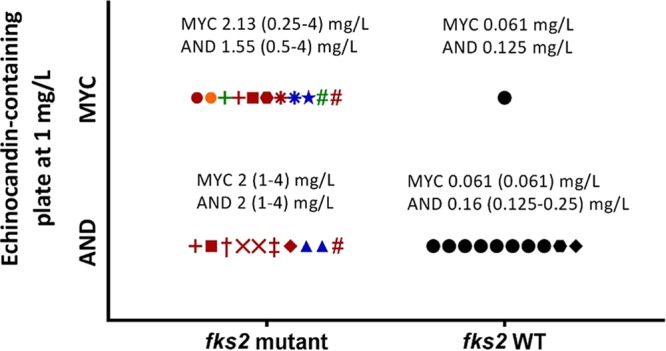
FIG 2.

Echinocandin-resistant colonies growing on echinocandin-containing plates (at 1 mg/liter) grouped according to the presence or absence of FKS2 mutations. The range and geometric mean echinocandin MICs for each group are shown. Each symbol represents a colony; colonies with the same symbol shape come from the same isolate. The colors represent different FKS2 mutations (red, ΔF658; Blue, S663P; Green, W715L; orange, E655A). Symbols in black represent echinocandin-resistant but FKS2 wild-type colonies.
