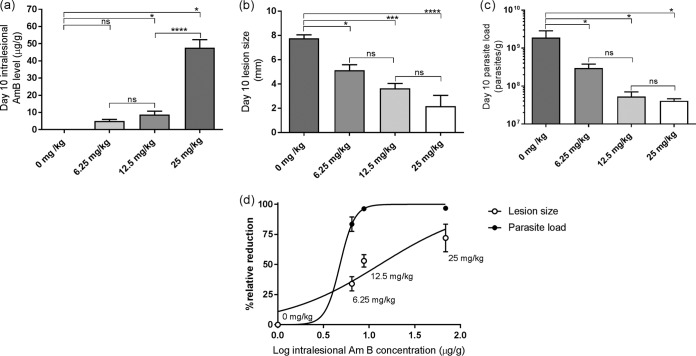
FIG 3.
Dose concentration-response relationship of AmBisome (LAmB) in experimental CL. L. major-infected mice received five doses of either 5% dextrose (0 mg/kg; untreated control) or 6.25, 12.5, and 25 mg/kg LAmB (i.v.). On day 10, resulting intralesional amphotericin B levels (a), lesion size (b), and parasite load (c) were evaluated. (d) Outcomes are linked in a logarithmic-scale dose-response curve plotting drug concentrations against relative reduction in lesion size and parasite load. Each point represents the means ± SEM (n = 4 to 5 per group). Differences among day 10 outcomes were analyzed using 1-way ANOVA followed by Tukey's multiple-comparison tests and considered significant at P values of <0.05 (*), <0.01 (**), <0.001 (***), and <0.0001 (****). ns, not significant.

