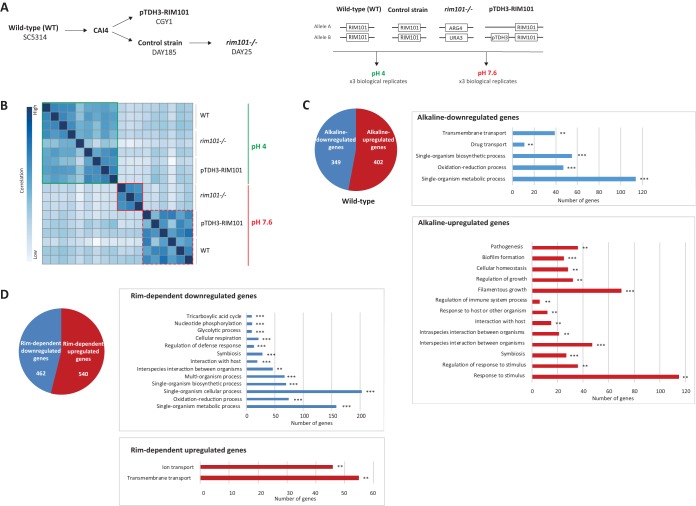
FIG 3.
Transcriptome analysis of a rim101Δ disruption strain (DAY25), a strain overexpressing RIM101 (CGY1), and the SC5314 reference strain. (A) (Left) Strain lineage. (Right) Experimental design of RNA-Seq experiments. (B) Unsupervised hierarchical clustering of the distances between the SC5413 reference strain, the rim101Δ disruption strain (DAY25), and the RIM101-overexpressing strain (CGY1). Data for all replicates are presented. (C) Alkaline pH-upregulated and -downregulated genes in the SC5413 reference strain. The graphs show the results of GO term enrichment analysis of biological processes among alkaline pH-upregulated and -downregulated genes. The number of genes is expressed on the x axis. **, P < 0.01; ***, P < 0.001. (D) Rim-dependent upregulated and downregulated genes in the rim101Δ disruption strain (DAY25) compared to those in the SC5413 reference strain at pH 7.6. The graphs show the results of GO term enrichment analysis of biological processes among Rim-dependent upregulated and downregulated genes. The number of genes is expressed on the x axis. **, P < 0.01; ***, P < 0.001.

