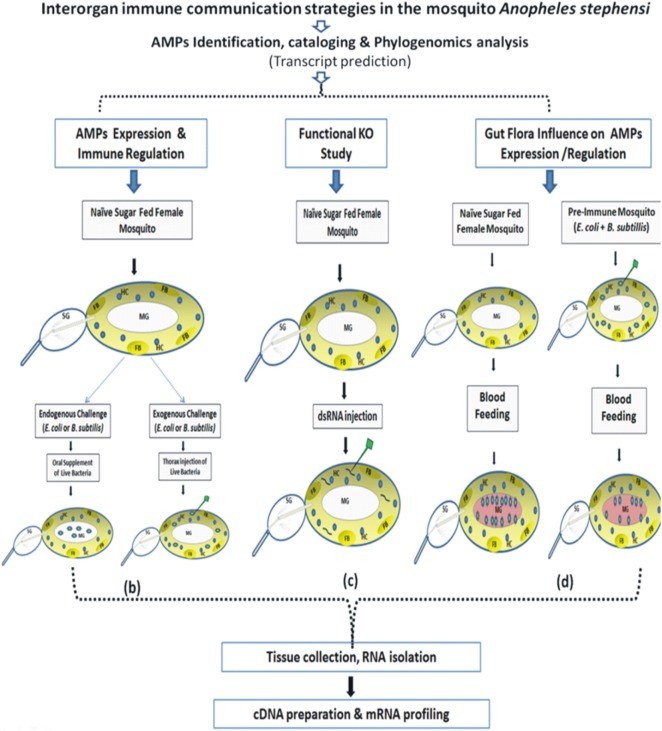
Figure 1.
Technical overview and basic methodology followed to understand the molecular and functional correlation of interorgan immune network communication. Fat body (FB): yellow color; hemocyte (HC): blue circle; midgut (MG); salivary gland (SG); bacteria: green colored stars (see text for detail).

