
FIGURE 4.
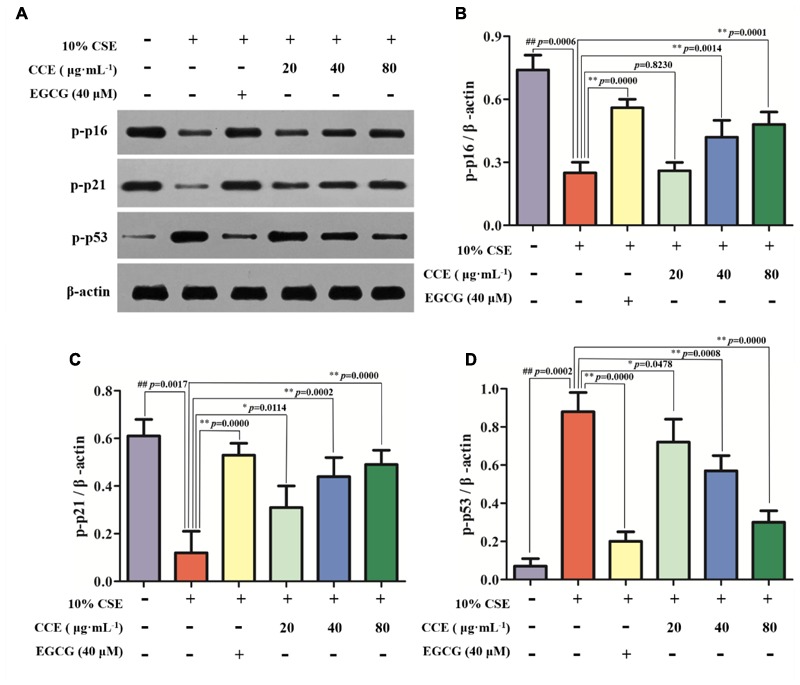
Effects of CCE on the phosphorylation levels of p-p16, p-p21, and p-p53 in 10%CSE-induced NHBE cells. NHBE cells were incubated for 24 h with 10% CSE in the presence or absence of 20, 40, 80 μg⋅mL-1 CCE or 40 μM EGCG. (A) Protein bands; (B) Effect of CCE on the relative expression of p-p16 protein in NHBE cells; (C) The relative expression of p-p21 protein; (D) p-p35 protein in NHBE cells. Data are expressed as means ± SD (n = 3). ##p < 0.01, vs. the blank control; ∗p < 0.05, ∗∗p < 0.01, vs. 10%CSE.