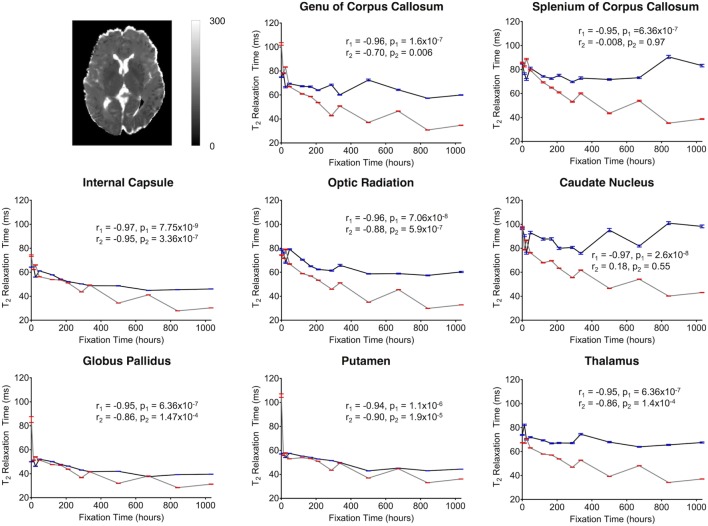
Figure 8.
Plots of T2-relaxation time vs. formalin fixation time are shown for eight structures (genu of corpus callosum, splenium of corpus callosum, internal capsule, optic radiation, caudate nucleus, globus pallidus, putamen, and thalamus). The x-axis shows the time in hours, where x = 0 is the time of first formalin immersion. The y-axis shows the T2 values in each structure. The lines with red and blue error bars (95% CIs) represent measurements from Subject 1 and Subject 2, respectively. Plots show T2 changes in each structure throughout the fixation. An example T2 map from Subject 2 has been shown in the top left.

