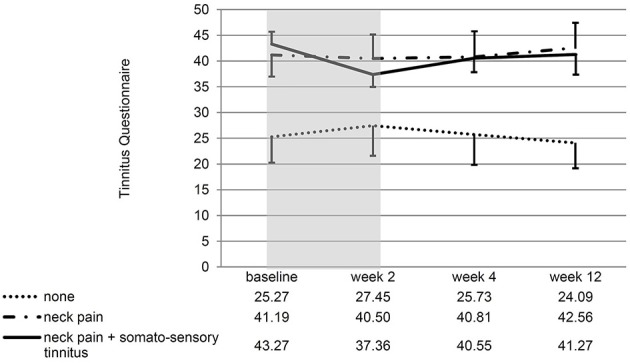
Figure 5.

Line chart showing the score at all measurement time points for all three subgroups of patients. Error bars represent standard errors. The 10-day treatment phase is marked in gray color. The TQ change from baseline to week 2 of patients with both somatosensory tinnitus and neck pain differed significantly from the TQ change of patients with neither condition.
