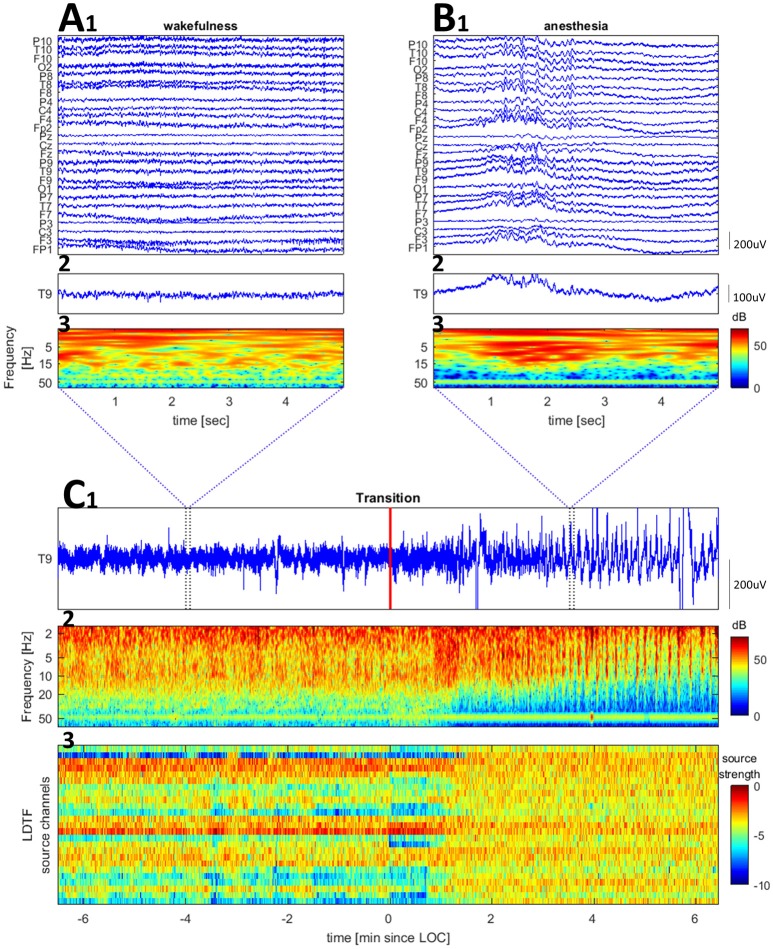
Figure 1.
Examples of raw EEG and time-frequency plots for a channel (Cz of patient 6) and the LDTF timecourse across the transition from wake to anesthesia. (A,B) Show zoomed segments of raw EEG samples and time-frequency plot taken from the regions marked by blue vertical bars in (C). The wavelet transform used 2 s windows, with 68 wavelets (covering 2–70 Hz) each with 12 cycles within the window. (C) Shows a raw EEG (top), time-frequency plot of wavelet transformed EEG data (middle), and LDTF source strength timecourse (bottom) accross the wakefulness to anesthesia transition (the red vertical line marks the time at which the anesthesiologist indicated the patient was anesthetized).

