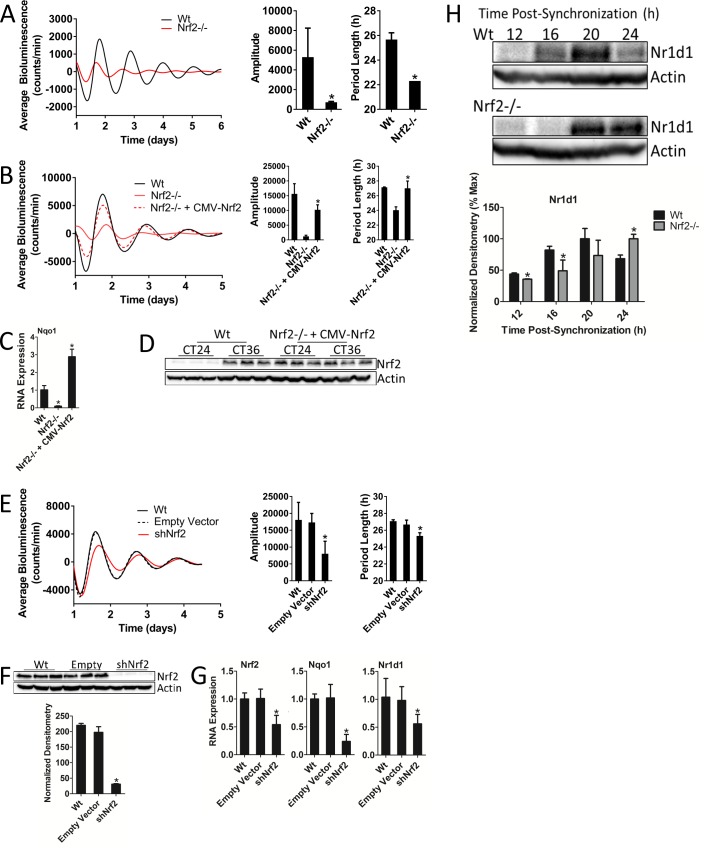
Figure 2. Nrf2 is required for normal circadian timekeeping.
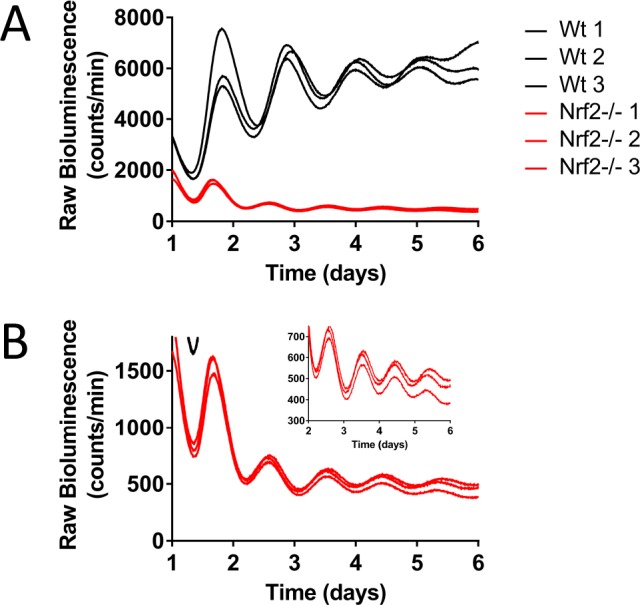
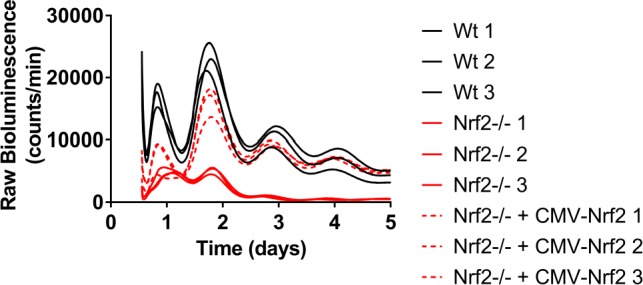
(A) Per2:Luc-driven bioluminescence from Wt and Nrf2-/- MEFs. Average luminescence recordings are shown on the left. Amplitude and period length are expressed as an average ±standard deviation (n = 3). Results were analyzed using Student’s t-test; * indicates a p-value<0.05 relative to Wt. (B) Per2:Luc-driven bioluminescence from Wt, Nrf2-/-, and Nrf2-/- MEFs stably expressing an Nrf2 expression construct (Nrf2-/- + CMV-Nrf2). Average luminescence recordings are shown on the left. Amplitude and period length are expressed as an average ±standard deviation (n = 3). Results were analyzed using Student’s t-test; * indicates a p-value<0.05 relative to Nrf2-/-. (C) Nqo1 gene expression in Wt, Nrf2-/-, and Nrf2-/- + CMV-Nrf2 MEFs. Expression values were determined by qPCR and normalized to Gapdh. Data is shown as the average fold-change ±standard deviation (n = 3) relative to the expression in Wt, which was set to 1. Results were analyzed using a one-way ANOVA followed by Dunnett’s multiple comparisons test; * indicates a p-value<0.05 relative to Wt. (D) NRF2 expression in 50 μg of whole cell lysate from Wt and Nrf2-/- + CMV-Nrf2 MEFs and harvested 24 hr or 36 hr post-synchronization. β-Actin, which was unchanged by exogenous Nrf2 expression, was used as a loading control. Average densitometric values ± standard deviation equal 14.22 ± 2.39 and 107.14 ± 16.68 for Wt 24 hr and 36 hr post-synchronization, respectively. Average densitometric values (±standard deviation) equal 157.4 ± 12.37 and 160.16 ± 18.09 for Nrf2-/- + CMV-Nrf2 24 hr and 36 hr post-synchronization, respectively. (E) Per2:Luc-driven bioluminescence from Wt and Wt MEFs stably expressing an empty shRNA vector (Empty Vector) or a shNrf2 vector (shNrf2). Average luminescence recordings are shown on the left. Amplitude and period length are expressed as an average ±standard deviation (n = 4). Results were analyzed using Student’s t-test; * indicates a p-value<0.05 relative to the Empty Vector. (F) NRF2 expression in 50 μg of whole cell lysate from Wt, Empty Vector (Empty), and shNrf2 MEFs. β-Actin, which was unchanged by shRNA expression, was used as a loading control. Values are expressed as the normalized average densitometry ±standard deviation (n = 3). Results were analyzed using Student’s t-test; * indicates a p-value<0.05 relative to the Empty Vector. (G) Nrf2, Nqo1, and Nr1d1 gene expression in Wt, Empty Vector, and shNrf2 MEFs. Expression values were determined by qPCR and normalized to Gapdh. Data is shown as the average fold-change ±standard deviation (n = 3) relative to the expression in Wt, which was set to 1. Results were analyzed using Student’s t-test; * indicates a p-value<0.05 relative to the Empty Vector. (H) NR1D1 protein in 50 μg of whole cell lysate from Wt and Nrf2-/- MEFs at the indicated times post-synchronization. β-Actin, which was unchanged by genotype or collection time, was used as a loading control. Values are expressed as the normalized average densitometry ±standard deviation (n = 3) relative to the time point in which expression was maximal, which was set to 100%. Results were analyzed using Student’s t-test; * indicates a p-value<0.05 relative to the time matched Wt sample.
Figure 2—figure supplement 1. Nrf2 is required for normal circadian timekeeping.

Figure 2—figure supplement 2. Nrf2 is required for normal circadian timekeeping.

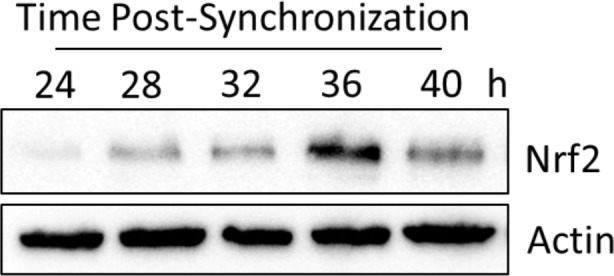
Figure 2—figure supplement 3. Characterization of Nrf2 circadian expression dynamics for Figure 4D.


