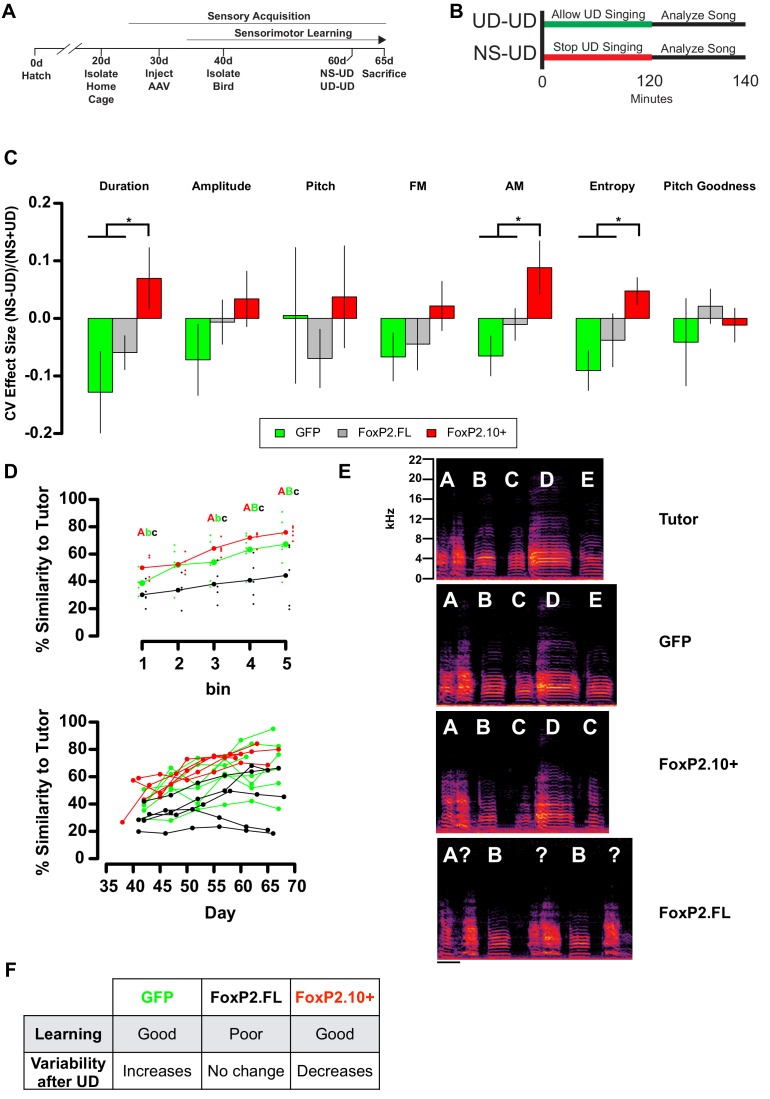
Figure 2. Overexpression of FoxP2 isoforms affect song learning and/or song variability.
(A) Timeline of experimental procedures relative to critical periods in song development. (B) Schematic illustrates NS-UD or UD-UD experiments performed on adjacent days. (C) The effect size of two hours of UD singing on syllable CV was calculated using the formula (NS-UD)/(NS + UD) after an NS-UD, UD-UD experiment performed at ~60d and 61d as in (B). Overexpression of FoxP2.FL (grey bars; n = 16 syllables; Duration = −0.059 ± 0.029; AM = −0.010 ± 0.028; Entropy = −0.038 ± 0.04) diminishes singing induced variability relative to that seen in GFP-expressing controls (green bars; n = 9 syllables; Duration = −0.128 ± 0.071; AM = −0.065 ± 0.035; Entropy = −0.091 ± 0.034). In contrast, overexpression of FoxP2.10+ (red bars; n = 13 syllables; Duration = 0.070 ± 0.054; AM = 0.088 ± 0.047; Entropy = 0.048 ± 0.029) leads to a singing-induced state of relative invariability. Values and bar heights represent the average effect size for all syllables within the virus construct group ±SEM. * denotes significant result in one-way ANOVA (Duration: F(2,35) = 3.95, p=0.028; AM: F(2,35) = 3.96, p=0.028; Entropy: F(2,35) = 3.63, p=0.037) and Tukey’s HSD post-hoc test (p<0.05). (D) Learning curves plot the relationship between percentage similarity to tutor as a function of time. Animals overexpressing GFP (green; letter ‘B’; n = 7 birds;~65 d similarity = 67.2 ± 6.64%) or FoxP2.10+ (red, letter ‘A’; n = 5 birds;~65 d similarity = 75.8 ± 2%) learn significantly better than those overexpressing FoxP2.FL (grey, letter ‘C’; n = 5 birds;~65 d similarity = 44.3 ± 10.1%). Values are mean ±SEM. Data are binned by day (top panel; bold points represent group mean and shifted smaller points are individual birds) or by individuals (bottom panel). Significantly different groups tested by one-way ANOVA (Bin 1:~40d F(2,11) = 6.06, p=0.016; Bin 3:~55d F(2,13) = 6.04, p=0.014; Bin 4:~60d F(2,14) = 9.94, p=0.002; Bin 5:~65d F(2,14) = 4.76, p=0.026) and Tukey HSD post-hoc test (p<0.05) are denoted by capital and lowercase lettering. (E) Exemplar motifs of a tutor and three of his 65d pupils, each of which was injected with a different viral construct at 30d. These examples illustrate the percent similarity depicted in panel D. (F) Summary of the learning and variability phenotypes observed after virus injection.


