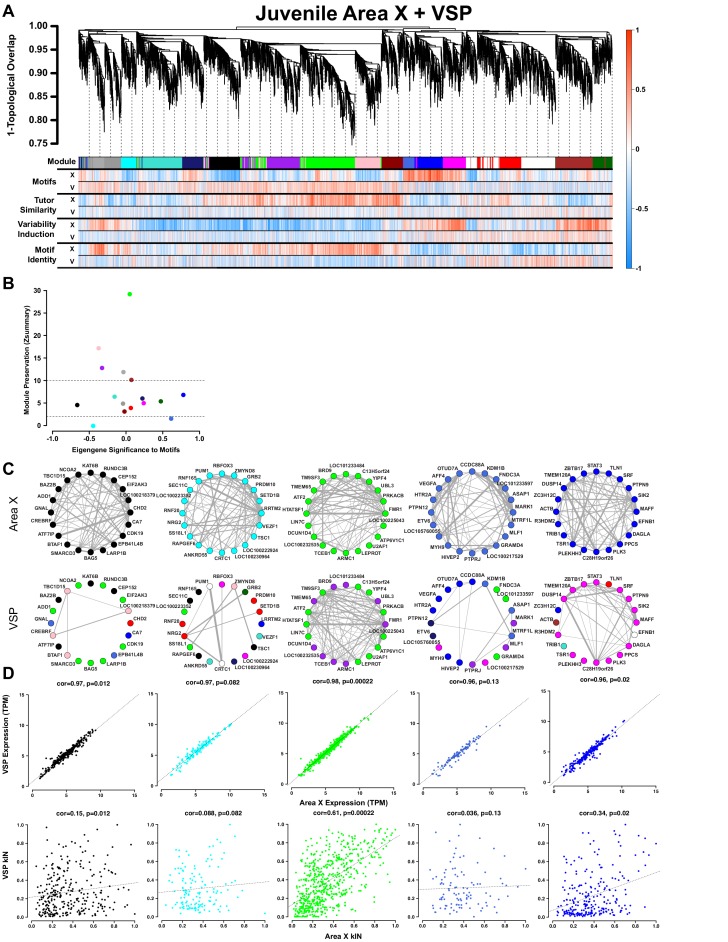
Figure 4. Juvenile Area X singing related gene coexpression patterns are not preserved in juvenile VSP.
(A) Dendrogram (top) displays the topological overlap in Area X between genes common to both juvenile Area X and VSP networks. Beneath, the module assignments and the gene significances for each gene as calculated using expression from VSP (‘V’) or Area X (‘X’) for all behaviors are quantified as in Figure 3A. Module colors are consistent with those presented in Figure 3. (B) Module preservation (Zsummary) for all modules that were present in both Area X and VSP displayed as a function of module eigengene correlation to motifs. Lower and upper dashed horizontal lines indicate thresholds for low and high preservation, respectively. (C) Circle plots display the adjacencies between the 20 most well-connected genes in the Area X black, cyan, green, royalblue, and blue modules. The adjacency between genes is indicated by edge thickness. Genes grouped together in the black, cyan, royalblue, and blue song modules in Area X have numerous and strong connections. Those connections are weakened or nonexistent in VSP such that genes sort into different modules in VSP. In contrast, the green learning-related module genes maintain their common grouping and connections in VSP. (D) Raw gene expression is tightly correlated between Area X and VSP for the genes in the black, cyan, green, royalblue, and blue modules (top). Only the intramodular connectivity of the genes in the green learning-related module is correlated between Area X and VSP (bottom). Dashed lines represent the linear regression.

