
Author response image 7. The intersample correlation for the Area X samples does not clearly delineate clusters by virus construct.
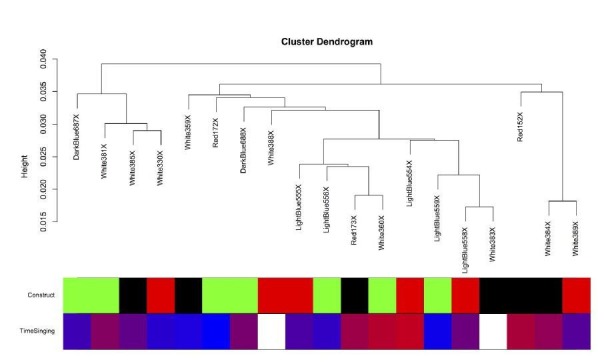
Virus construct is indicated in green (GFP), black (FoxP2.FL), and red (FoxP2.10+). Below, time singing is indicated on a blue-red color scale where the samples from birds that sang the most are colored the deepest red.