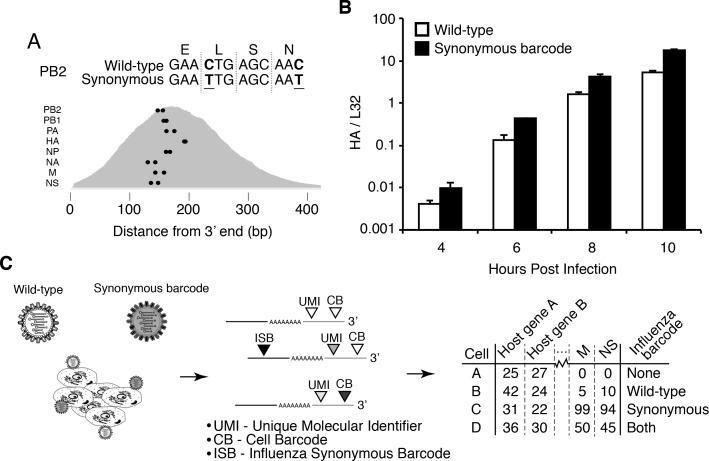
Figure 1. Experimental design.
(A) We engineered a virus that carried two synonymous mutations near the 3’ end of each mRNA. At top are the mutations for PB2. At bottom are locations of the synonymous mutations relative to the typical distribution of read depth for our 3’-end sequencing. (B) The wild-type and synonymously barcoded viruses transcribe their genes with similar kinetics. The abundance of the viral hemagglutinin (HA) transcript relative to the cellular housekeeping gene L32 was assessed by qPCR in A549 cells infected at an MOI of 0.5 (as determined on MDCK-SIAT1 cells). Error bars S.D., n = 3. (C) For the single-cell mRNA sequencing, A549 cells were infected with an equal mixture of wild-type and synonymously barcoded virus. Immediately prior to collection, cells were physically separated into droplets and cDNA libraries were generated containing the indicated barcodes. The libraries were deep sequenced, and the data processed to create a matrix that gives the number of molecules of each transcript observed in each cell. Infected cells were further annotated by whether their viral mRNAs derived from wild-type virus, synonymously barcoded virus, or both.

