. 2018 Feb 16;7:e32303. doi: 10.7554/eLife.32303

Figure 4. Synonymous barcodes on the viral mRNAs distinguish true infections from cells that contain viral mRNAs derived from leakage of lysed cells.

(A) Cells with at least two viral mRNAs for which the barcode could be called, arranged in order of increasing influenza transcript counts. Bar heights denote the number viral mRNAs on a log10 scale, bar coloring is linearly proportional to the fractions of viral mRNAs derived from wild-type and synonymously barcoded virus. (B) Same as (A), but each bar is colored according to the relative fraction of the more common (major) and less common (minor) virus variant. At low levels of viral mRNA there is often a roughly equal mix, suggesting contamination with viral mRNAs leaked from lysed cells. At higher levels of viral mRNA, cells generally have only one viral variant, suggesting infection initiated by a single virion. A few cells are also obviously co-infected with both viral variants. (C) We determined a threshold for calling ‘true’ infections by finding the amount of viral mRNA per cell at which the viral barcode purity no longer increases with more viral mRNA. The purity is the fraction of all viral mRNA in a cell derived from the most abundant viral barcode in that cell. We fit a curve (orange line) to the mean purity of all cells with more than the indicated amount of viral mRNA, and drew the cutoff (dotted green line) at the point where this curve stopped increasing with the fraction of total mRNA derived from virus. This plot illustrates the process for the 10 hr sample, see Figure 4—figure supplement 2 for similar plots for other samples. See the Materials and methods for details. (D) The number of cells identified as infected and co-infected for each sample, as well as the number of cells with any viral read. For all subsequent analyses, we subsampled the number of uninfected cells per sample to the greater of 50 or the number of infected cells. (E) Distribution of the fraction of mRNA per cell derived from virus for both infected and co-infected cells. Figure 4—figure supplement 3 shows these same data in a cumulative fraction plots and calculates Gini coefficients to quantify the heterogeneity in viral mRNA load.

Figure 4.

Figure 4—figure supplement 1. The number of viral barcodes called for each sample and gene segment.

Figure 4—figure supplement 1.

Viral transcripts are classified as syn if they mapped to a synonymously barcoded influenza transcript, wt if they mapped to a wild-type influenza transcript, invalid if multiple reads for the same UMI differed on the status of the viral barcode, and as uncalled if none of the reads for that UMI overlapped the region of the viral transcript containing the viral barcode. For calculations of the number of reads in a cell derived from each viral barcode for each viral gene, the total number of detected molecules of that gene are multiplied by the fraction of those molecules with assignable barcodes that are assigned to that barcode.
Figure 4—figure supplement 2. Thresholds for calling infected cells.

Figure 4—figure supplement 2.

Cell lysis can lead cells to the spurious association of small amounts of extraneous mRNA with individual cells. We wanted to avoid classifying as infected cells that had simply acquired such lysis-derived viral mRNA. The amount of lysis-derived viral mRNA will vary among samples as a function of both the lysis rate during the cell preparation (which always varies slightly from sample to sample in the 10X procedure) and with the amount of total viral mRNA for that sample (the more viral mRNA, the more there is to be acquired from lysed cells). As is shown in Figure 4B, the 8 hr-2 and 10 hr sample clearly have an enrichment of mixed barcodes in cells with small numbers of viral mRNA. For each sample, we calculated the mean purity of all cells with at least the indicated amount of viral mRNA, and determined the threshold amount of viral mRNA where purity no longer increased by finding the first maxima in a loess curve fit (orange line). We called the threshold at this point of maximum purity (dotted green line). For the 6 hr and 8 hr samples there is no indication of contamination from lysis-derived reads, as Figure 4B shows no increase in mixed barcodes in low viral mRNA cells. Therefore, for these samples we simply set a threshold of requiring at least 2×10⁻⁴ of the total mRNA to come from virus, which corresponds to 2 viral mRNAs for the typical cell with 104 total reads (Figure 3B).
Figure 4—figure supplement 3. Cumulative distributions of viral mRNA per cell and Gini coefficients.

Figure 4—figure supplement 3.

The total fraction of all viral mRNA among infected cells that is attributable to a given fraction of these cells. For instance, the plot for the 8 hr sample shows that 50% of all viral mRNA is derived from 8% of the infected cells. The facet titles above each plot also give the Gini coefficient (Gini, 1921) that calculates the heterogeneity in the distribution of viral mRNA among infected cells. Gini coefficients of 0 indicate a perfectly even distribution across cells, and Gini coefficients of 1 indicate a maximally skewed distribution.
Figure 4—figure supplement 4. Synchronization of infection does not greatly affect heterogeneity.

Figure 4—figure supplement 4.

Flow cytometry analysis of expression of viral proteins in cells infected at an MOI of 0.1 (unsynchronized) or 0.2 (synchronized) as calculated by TCID50 on MDCK-SIAT1 cells. The higher MOI for synchronized infections was to attempt to account for loss of virus in washing steps. Infections were synchronized by pre-adsorbing virus at 4C for 1 hr prior to initiation of infection by shifting temperature to 37C using pre-warmed media. Cells were concurrently stained for HA and NS1 proteins at 10 hr after initiation of infection, and then analyzed by flow cytometry. The level of HA protein was quantified in cells that were identified as infected based on being positive for NS1 protein (top), and the level of NS1 protein was quantified in cells that were identified as infected based on being positive for HA protein (bottom) Synchronization resulted in a small decrease in variability in the levels of each viral protein, particularly in cells with intermediate levels. But the effects were small compared to the overall variability in the protein levels, indicating timing of infection makes only a small contribution to the observed heterogeneity. Data are shown for three independent replicates.
Figure 4—figure supplement 5. Effects of infectious dose or coinfection state.
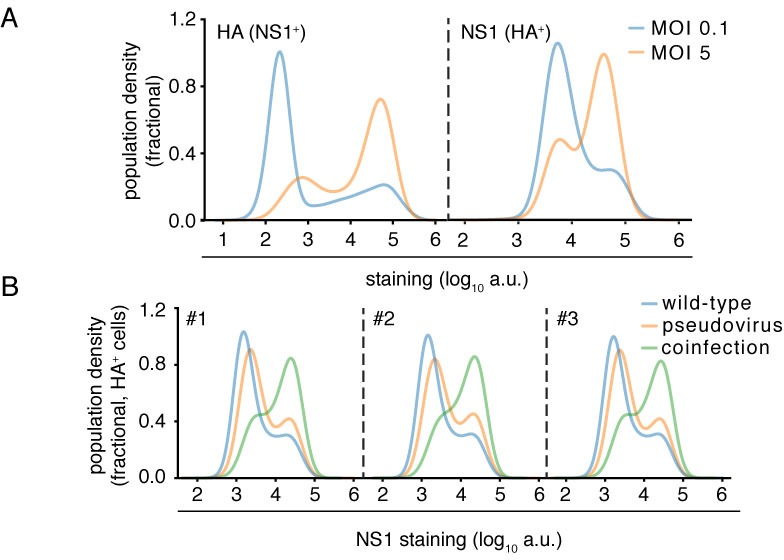
Figure 4—figure supplement 5.

(A) Flow cytometry analysis of expression of viral proteins in cells infected at high (MOI five as calculated by TCID50 on MDCK-SIAT1 cells) or low (MOI 0.1) initial infectious dose. Cells were concurrently stained for HA and NS1 proteins at 10 hr after initiation of infection, and then analyzed by flow cytometry. The level of HA protein was quantified in cells that were identified as infected based on being positive for NS1 protein (left), and the level of NS1 protein was quantified in cells that were identified as infected based on being positive for HA protein (right) While a higher dose leads to more cells expressing high amounts of viral protein, it does not greatly increase the amount of viral protein in either the low-expressing or high-expressing cells. Therefore, higher viral dose does not lead to a large continuous increase in viral protein production among all cells – rather, it mostly changes the proportions of cells that fall in different parts of the highly heterogeneous distribution. (B) Cells were co-infected with a mix of wild-type virus and pseudovirus in which the HA gene was replaced by GFP flanked by the terminal regions of the HA gene segment at an MOI of 0.1 for each virus. At 10 hr post-infection, cells were stained for NS1 and HA expression and analyzed by flow cytometry for these proteins and GFP. Cells could be annotated as infected by virions of the same type (wild-type infection indicated by presence of HA, or pseudovirus infection indicated by the presence of GFP) or both types of virions (indicated by presence of HA and GFP). Coinfected cells, like cells infected at a higher infectious dose, occupy different positions in the distribution of viral protein production but do not not exhibit a continuous increase in viral protein production. Data are shown for three independent replicates.