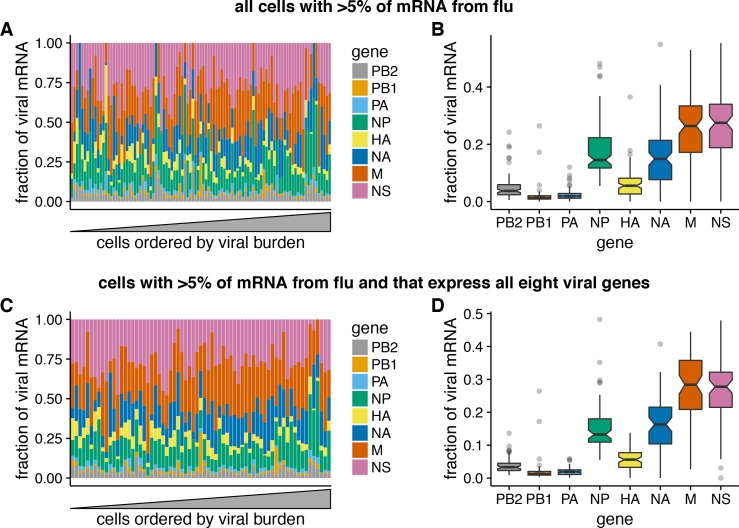
Figure 6. Relative expression of influenza virus genes in highly infected cells (>5% of total mRNA from virus).
(A) The fraction of viral mRNA from each viral gene for each cell. (B) Box plots showing the distribution of the fraction of viral mRNA per cell from each viral gene. The black lines at the notches are the medians, and the tops and bottoms of boxes indicate the first and third quartiles. Whiskers extend to the highest or lowest data point observed within 1.5x the interquartile range, outliers shown as circles. Notches extend 1.58x the interquartile range divided by the square root of the number of observations. (C), (D) The same plots, but only including cells for which we observed at least one molecule of each viral gene.

