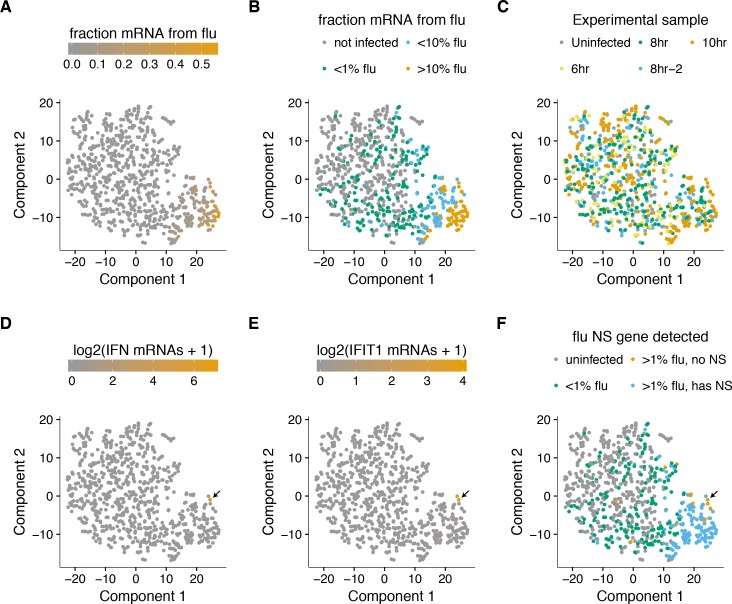
Figure 8. A t-SNE plot created by semi-supervised clustering using genes that co-vary with viral infection status.
Each point is a single cell, and each panel shows an identical layout but colors the cells according to a different property. (A), (B) Cells colored by the fraction of their mRNA derived from virus. (C) Cells colored by the experimental sample. (D) Cells colored by the number of detected transcripts from type I and III interferons (IFN). Only one cell has detectable interferon expression (in orange, indicated with arrow). (E) Cells colored by the expression of the interferon-stimulated gene IFIT1. (F) Cells colored by whether they express the viral NS gene. The one interferon-positive cell is lacking NS, but so are many interferon-negative cells.

